Version:
1.0
Updated:
24 March 2025
Downloads:
0
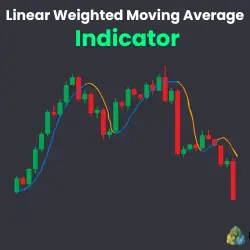
The linear weighted moving average (LWMA) is a technical analysis indicator on MetaTrader 5 that emphasizes recent price data, making it more responsive to price changes. Moreover, it is available on the MT4 platform. The LWMA helps traders assess trend direction, whether bullish or bearish, identify dynamic support and resistance levels, spot potential reversals, and determine informed entry or exit signals.
The Linear Weighted Moving Average is a trend-following indicator that generates more significance to recent price data. Unlike the simple moving average (SMA), which gives equal weight to all prices the LWMA applies a linear weighted factor, enhancing its sensitivity to price changes.
- LWMA = ∑(Price.i * Weight.i) / ∑Weight.i
Where;
- Price.i: Price at time i
- Weight.i: The weight assigned to each price ( most recent prices have the highest weight)
Additionally, the indicator helps traders, with several trading strategies, make accurate trade decisions, such as:
- Trend identification:
- If the price crosses above the LWMA line, which is colored blue, it signals a bullish trend and a buying opportunity.
- If the price drops below the indicator's line, which is colored orange, it signals a bearish trend and a selling opportunity.
- Dynamic Support and Resistance levels:
- During an uptrend, following a correction, the most recent shift in the line color from orange to blue is recognized as a support level.
- During a downtrend, following a correction, the most recent shift in the indicator color from blue to orange is identified as a resistance level.
- Potential reversal:
- Bearish reversal: If the price falls below the last support line, it signals a potential short opportunity.
- Bullish reversal: If the price rises above the last resistance line, it signals a potential long opportunity.
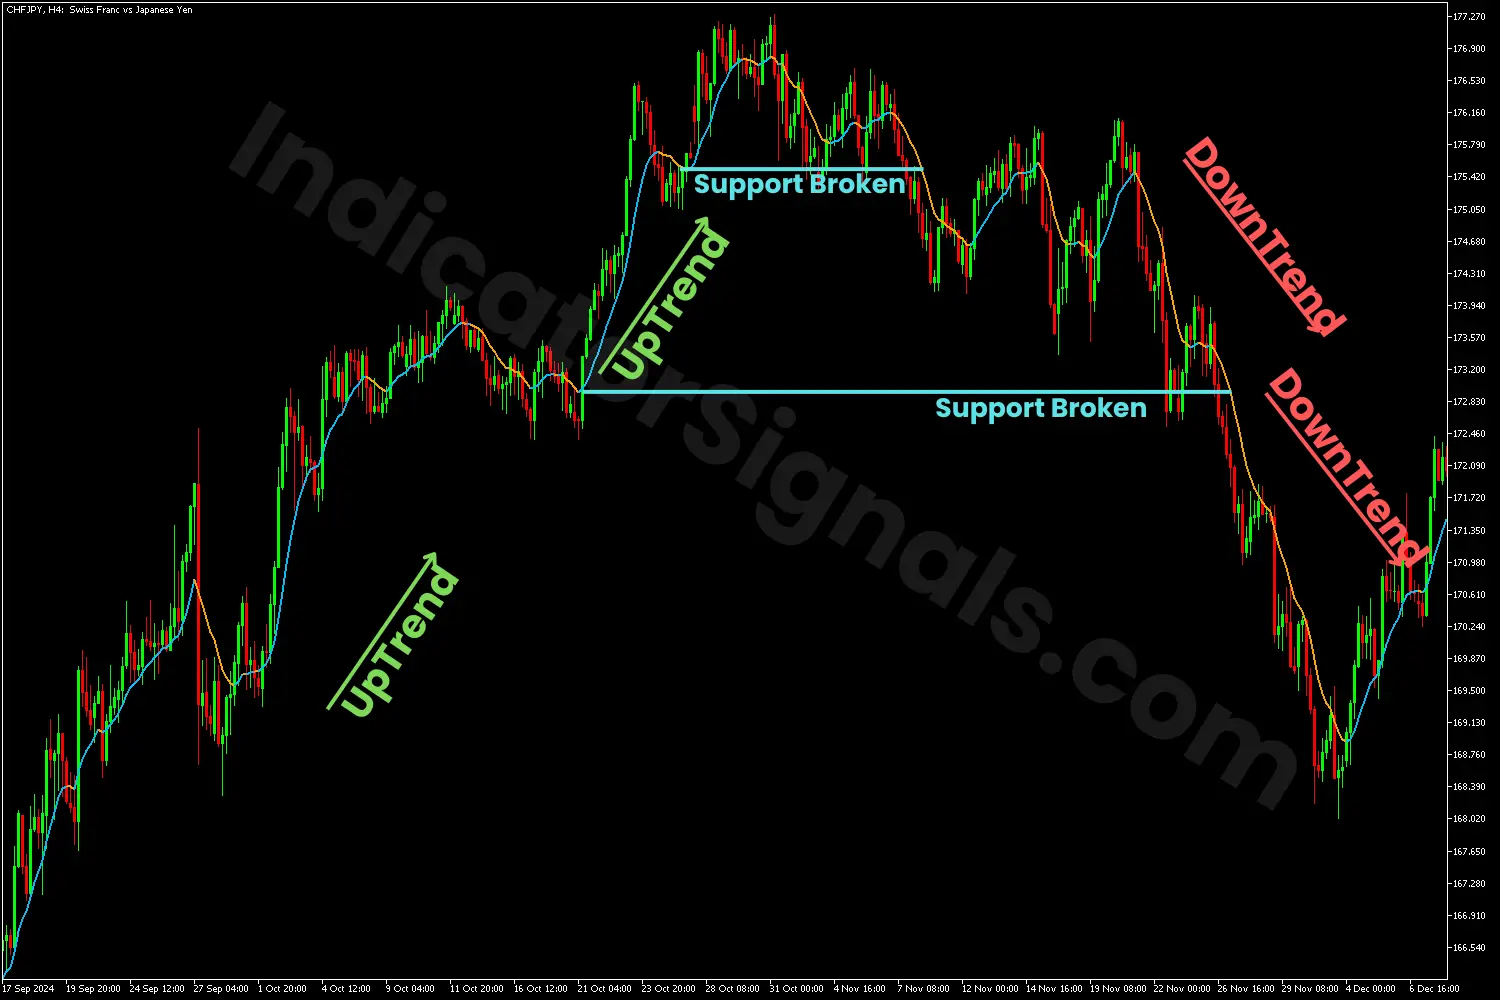
1- In the CHFJPY trading example on the MT4 chart, as the price remains above the blue-line lwma, it signals the continuation of the uptrend. During the bullish movement, the indicator helps identify support levels, whenever the price rebounds from it, it signals a potential buying opportunity.
Toward the trend's end, when the price falls below the orange-line lwma alongside a break of the support line, both suggest a bearish reversal. When the price keeps dropping and breaking another support line, it confirms the start of the downward trend and provides a strong short opportunity.
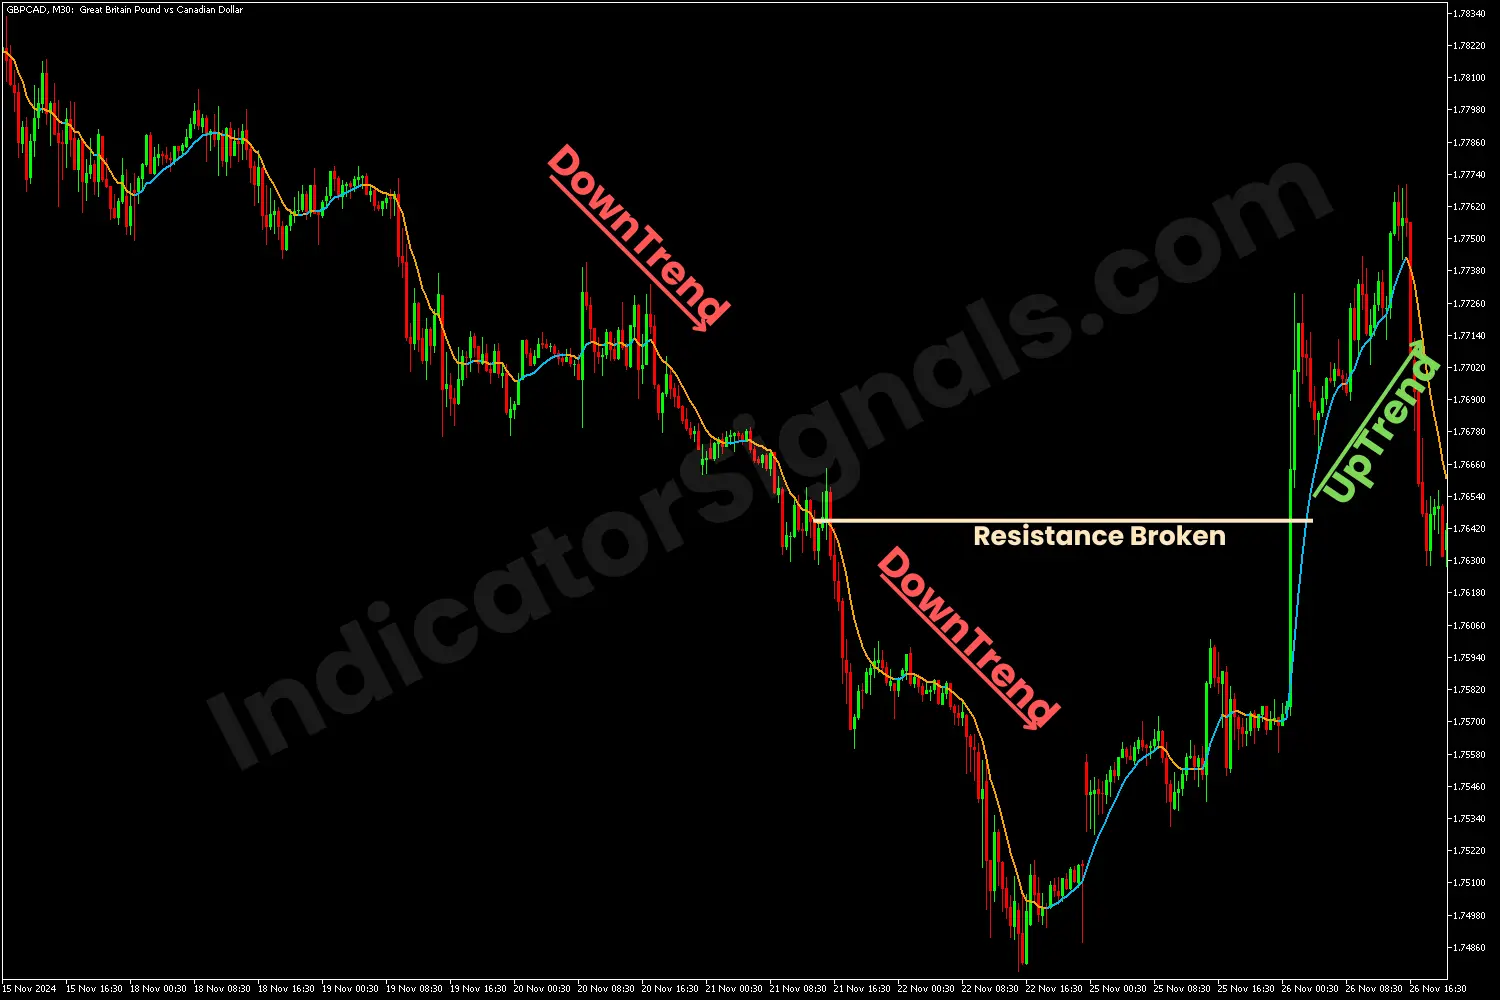
2- In the GBPCAD trading example on the MT5 chart, as the price stays below the orange-line lwma, it signals the continuation of the downtrend. During the bearish momentum, the indicator helps identify resistance levels, whenever the price bounces from it, it signals a potential short opportunity.
Toward the trend's end, when the price rises above the blue-line lwma alongside a break of the resistance line with a significant bullish candle, indicates a bullish reversal and a strong long opportunity.
IndicatorSignals.com - Owned & Operated By
FINANSYA LAB
|
2026 © All Rights Reserved.


