Version:
1.0
Updated:
09 April 2025
Downloads:
2
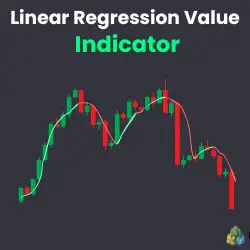
The Linear Regression Value Indicator on MetaTrader 4 plots the current value of a linear regression line (LRL) on the chart, helping traders identify the overall trend direction and potential reversals. Also available on the MT5 platform, it acts as a dynamic support and resistance level, filtering market noise and providing accurate entry and exit signals for trades.
The Linear Regression Value (LRV) is a trend-following indicator that displays the value of an LRL for a specific number of periods. Unlike typical moving averages that smooth past prices, this indicator fits a straight line through historical prices using the least-squares method, representing the best fit of price action.
Moreover, this indicator helps traders visualize the fair value of an asset, reacting to trend shifts, often used for identifying market direction, support and resistance levels, and potential trend reversals.
- Trend-following strategy:
- When the price crosses below the red line and remains below it, it signals a bearish trend.
- When the price breaks above the lime line and stays above it, it signals a bullish trend.
- Support and Resistance Levels:
- When the bearish line turns bullish, it indicates a potential support level.
- When the lime line turns red, it suggests a potential resistance level.
- Potential Reversal:
- If the price breaks below the last support level during an upward trend, it signals a potential bearish reversal.
- If the price moves above the ultimate resistance line during a downward trend, it indicates a potential bullish reversal.
By using this indicator, traders can determine optimal entry and exit points by applying the following classic trading principles:
* Long trades: Enter near the support level during an uptrend and exit around the resistance.
* Short trades: Enter close to the resistance line during a downtrend and exit near the support.
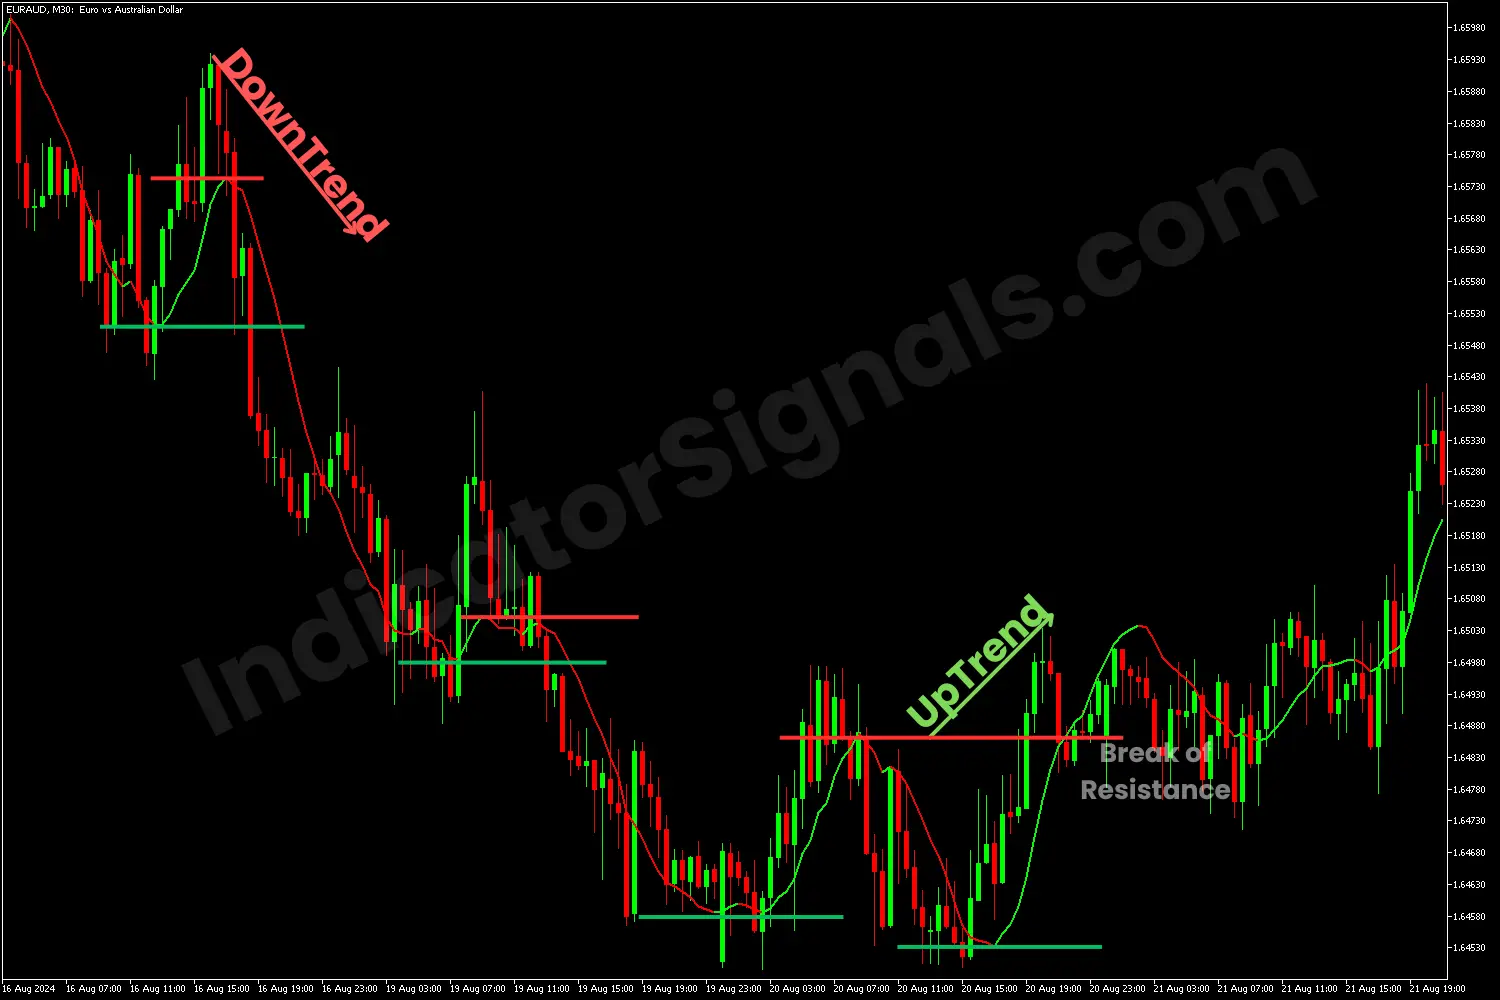
1- In the MT4 trading example, when the price falls below the bearish line of the LRV indicator, it suggests the beginning of a potential downtrend. After several bullish candles, the price declines again, breaking below both the bearish line and the dynamic support level derived from the indicator.
The bearish momentum continues as the price rebounds from resistance, signals a potential selling opportunity, and falls through support. Toward the trend's end, as shown on the EURAUD chart, the price breaks above the resistance level, suggesting a potential bullish reversal. When the price moves above the lime line, it signals a long opportunity to the trader and the start of an upward trend.
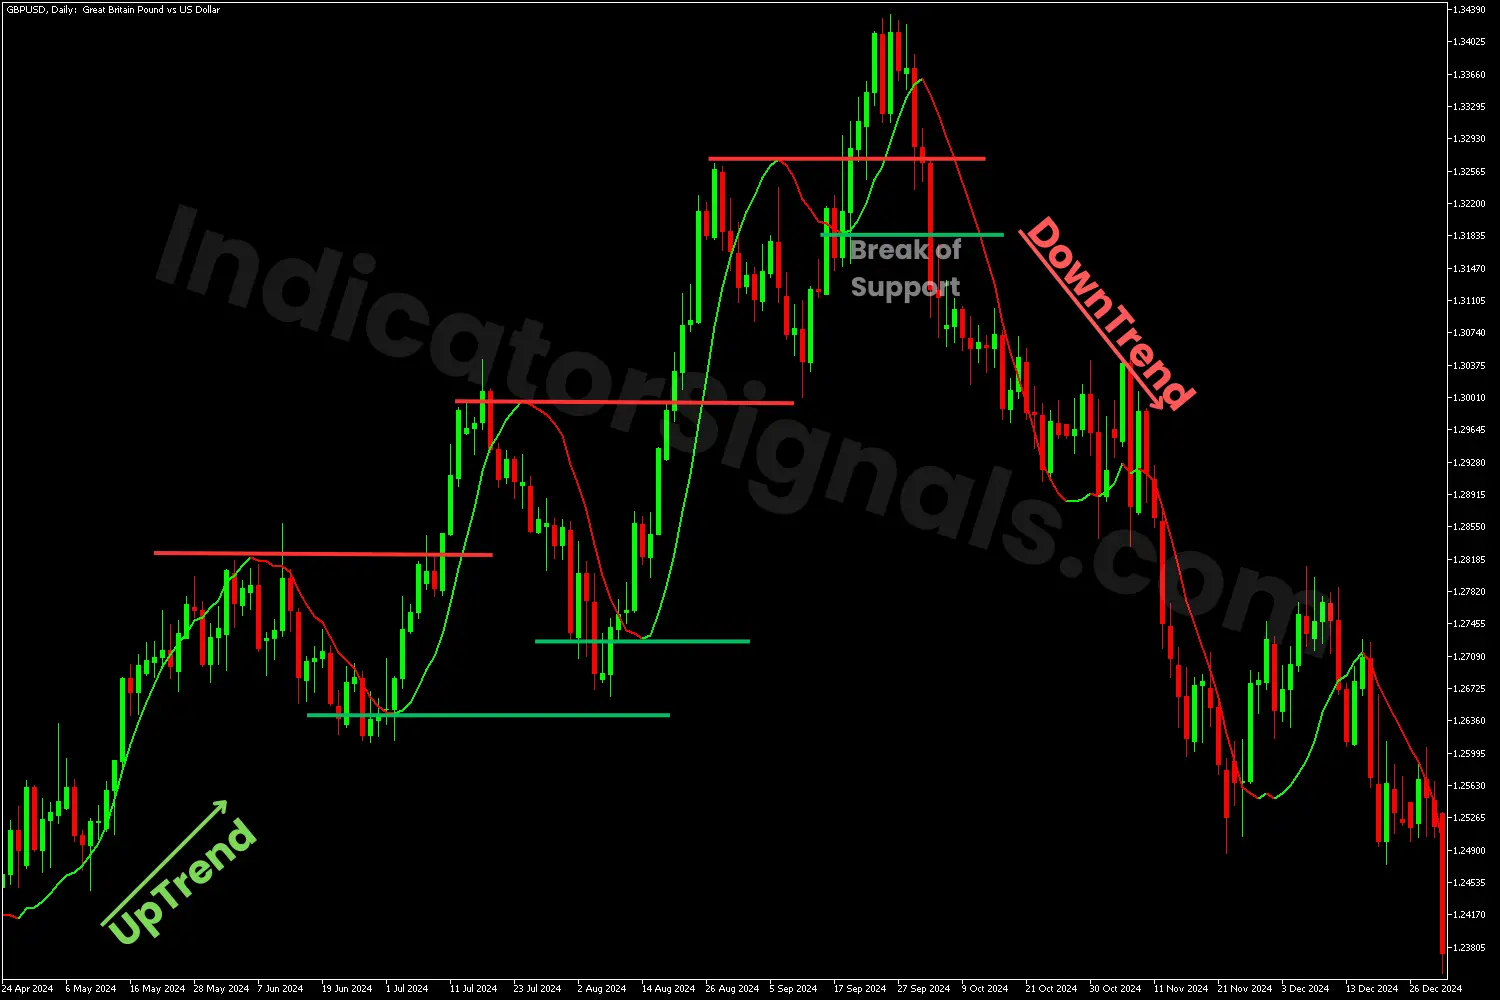
2- In the MT5 trading example, when the price rises above the bullish line of the LRV indicator, it suggests the start of a potential uptrend. After several bearish candles, the price rises again, breaking above both the bullish line and the dynamic resistance level derived from the indicator.
The bullish momentum continues as the price rebounds from support, signals a potential buying opportunity, and breaks through resistance. Near the trend's end, as shown on the GBPUSD chart, the price breaks below the support level, suggesting a potential bearish reversal. When the price falls below the red line, it signals a short opportunity to the trader and the beginning of a downward trend.
IndicatorSignals.com - Owned & Operated By
FINANSYA LAB
|
2026 © All Rights Reserved.


