Version:
1.0
Updated:
25 February 2025
Downloads:
1
The Laguerre Indicator on MT4 is a technical analysis indicator similar to the classic RSI with enhanced smoothing and minimal lag. It helps identify trend direction and its strength, overbought or oversold market conditions, and spot potential reversals. On a MetaTrader 5 chart, traders can also use this indicator to set entry and exit points, improving trade decisions.
The Laguerre Indicator is classified as an oscillator indicator that fluctuates between 0 and 1 levels. It is designed to identify overbought and oversold conditions. With some modification, this indicator acts like the classic RSI, offering traders more accuracy and clarity, helping them set entry and exit points, and confirming the trend's direction and strength.
Applied this indicator on a chart, traders can visualize three other levels (0.2, 0.5, and 0.8), except the 0 and 1 values, each one having its utility. Here below is how we can use these levels on this indicator for every trade strategy:
- Trend direction and strength:
- If the Laguerre line moves above the 0.2 level and then stays above the 0.5 level, it signals a strong bullish momentum.
- If the Laguerre line moves below the 0.8 level and then breaks below the 0.5, it signals a strong bearish momentum.
- Overbought and Oversold conditions:
- When the Laguerre line stays between the 0.8 and 1 levels, it signals an overbought condition, and the trader should anticipate a potential reversal to a downward trend.
- When the Laguerre line stays between the 0.2 and 0 levels, it suggests an oversold condition, and the trader should look for a buying opportunity.
- Divergence strategy:
- If the price makes a new high, but Laguerre remains lower, a bearish reversal might follow.
- If the price makes a new low, but Laguerre doesn't confirm it, a bullish reversal could be forming.
To help you understand how this indicator can enhance your trading strategies, I am gonna present three different trade scenarios, and in each one, the Laguerre indicator helps to make informed decisions.
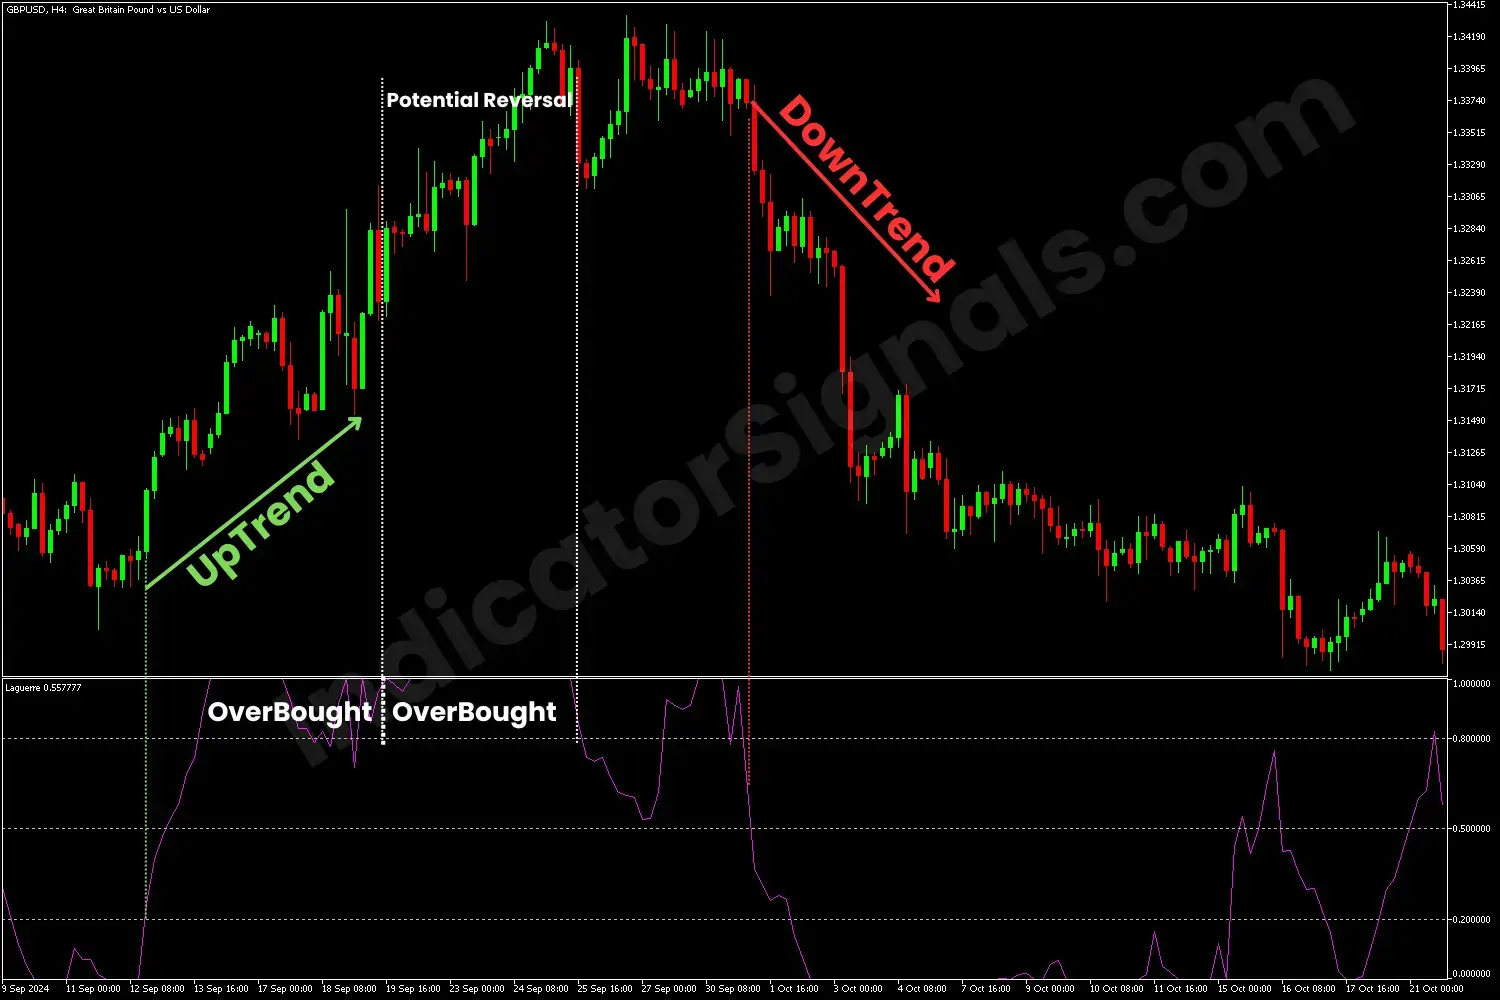
In the first example on the MT4 chart, at the start of the uptrend, the Laguerre line crosses above the 0.2 level and then the 0.5 level, confirming the continuation of the bullish movement. Toward the end of the trend, this indicator oscillates in the overbought zone, suggesting a bearish reversal. When the price drops and the Laguerree line falls below the 0.8 level, with the presentation of an important bearish candle, that confirms the beginning of the downtrend, and the trader should enter short for this GBPUSDpairs.
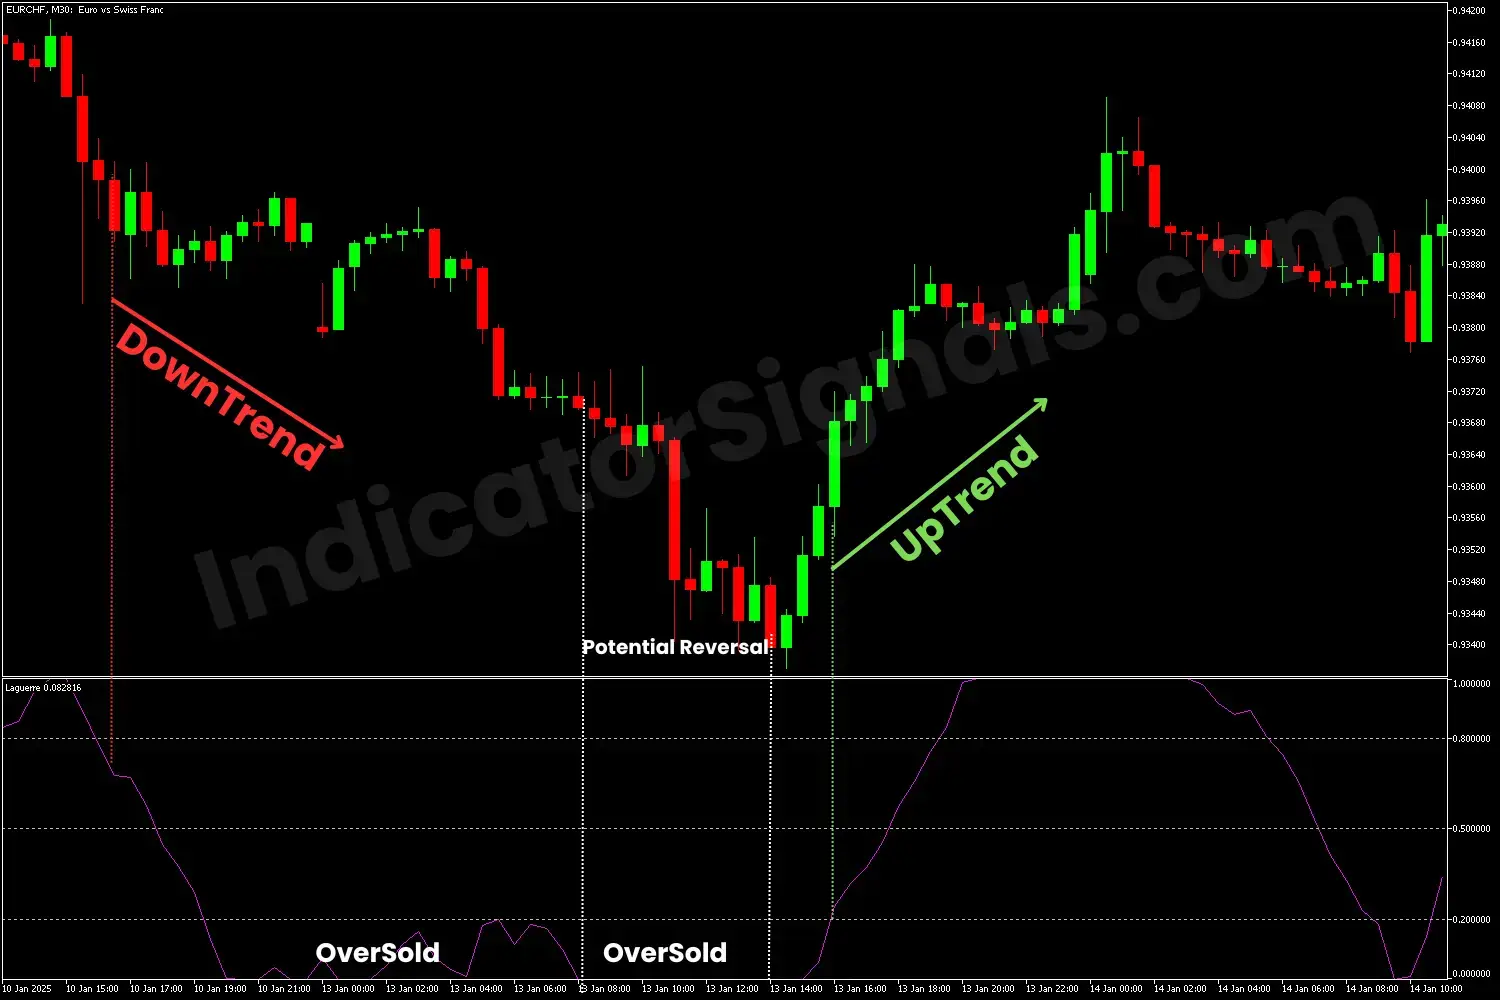
In the second example on the MT5 chart, at the beginning of the downtrend, the Laguerre line crosses below the 0.8 value and continues to drop below the 0.5 level, confirming the strength of the bearish momentum. Near the trend's end, the indicator fluctuates in the oversold zone, suggesting a bullish reversal. At the moment when the price rises, and the purple line of the indicator crosses the 0.2 level, with a confirmation of a green important cande in the EURCHF chart, all of that confirms what the Laguerre indicator has suggested, and the trader should exit his short position and enter long.
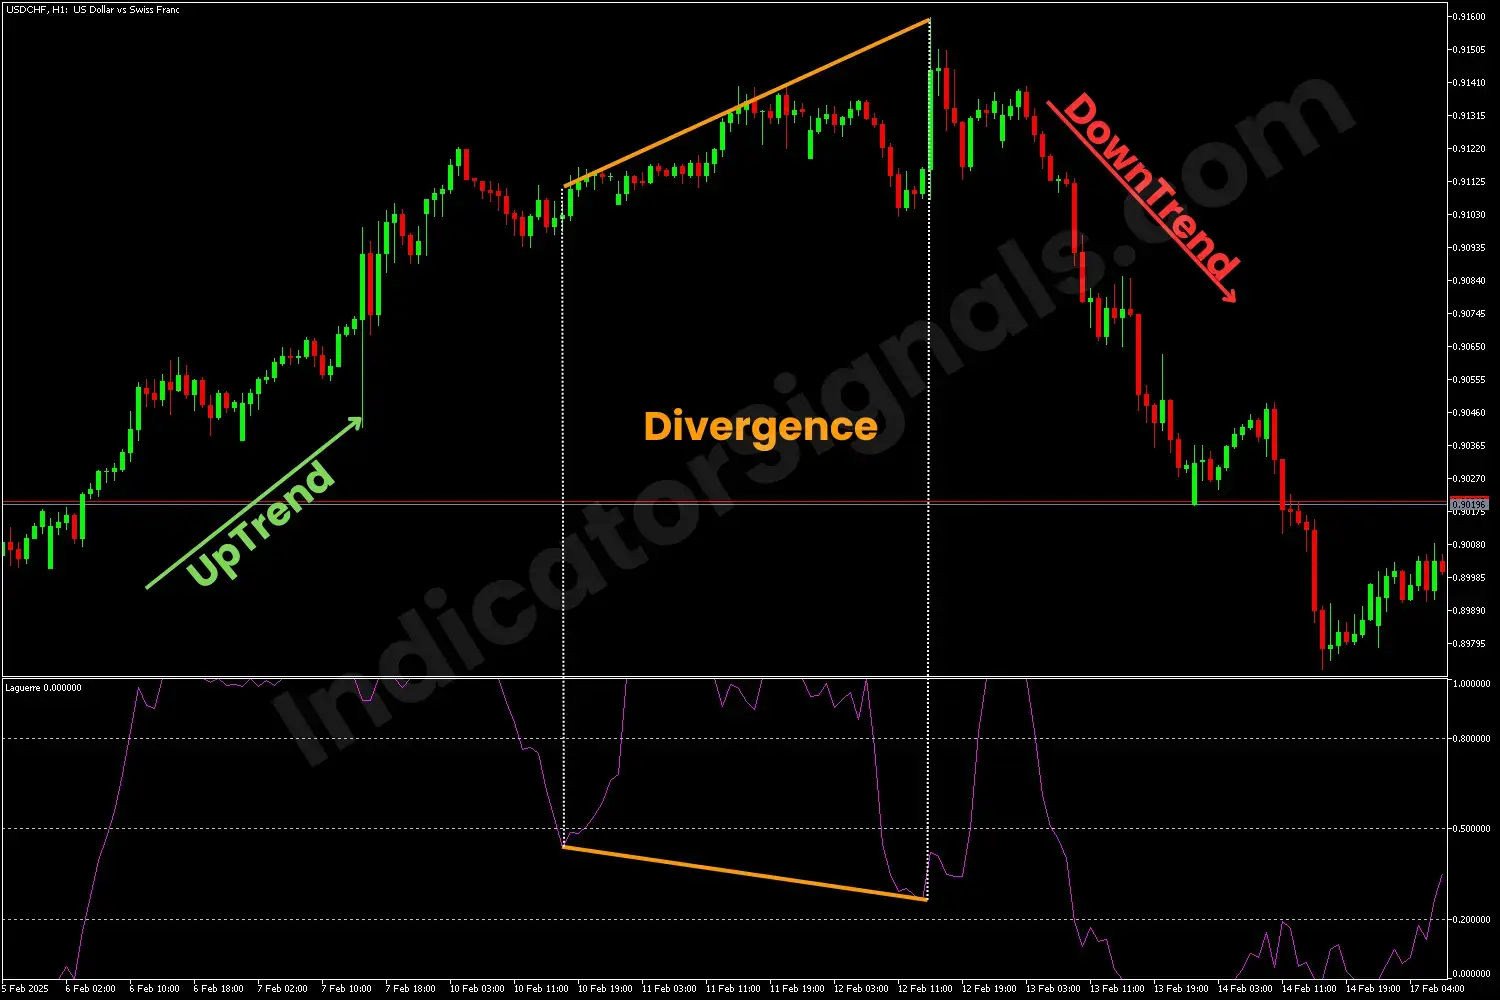
In the final example on an MT5 chart, this indicator highlights a different trading scenario. A divergence occurs when the price reaches a new high, but the Laguerre line remains lower, signaling a potential bearish reversal. In this case, the trader should exit their buy position and consider going short. Conversely, if the opposite happens, where the price makes a new low, but the Laguerre line remains higher, it indicates a bullish reversal, prompting the trader to exit their short position and go long.
IndicatorSignals.com - Owned & Operated By
FINANSYA LAB
|
2026 © All Rights Reserved.


