Version:
1.0
Updated:
02 June 2025
Downloads:
3
The iDouble Channel (iDC) for MetaTrader 4 is a technical analysis indicator that combines two lines moving as a channel, displayed as upper and lower boundaries which react to price movements. It helps traders, on the MT5 chart also, identify market trends and potential reversal points, enabling them to manage trading risks and to determine optimal entry and exit points.
The iDouble Channel (iDC) is a trend-following indicator specifically designed to help traders assess market direction and spot high-probability trade setups. It is composed of three dynamic lines, a central yellow baseline, a red line, and a blue line, each derived from moving averages of price data to reflect market trends and potential turning points with greater clarity.
- The red line serves a dual function: during bullish trends, it acts as a dynamic support level, while in bearish trends, it acts as a resistance level.
- The blue line helps identify potential reversals, especially when it crosses above or below the red line.
- The middle yellow line functions as a trend baseline, giving traders a general overview of the prevailing market direction.
In addition to the channel lines, the iDouble Channel indicator features color-coded arrows, blue for potential buy entries and red for potential sell signals, that appear on the chart in alignment with the underlying price action and channel conditions.
Traders can utilize two primary strategies with this indicator, depending on the market phase:
- Trend Continuation Strategy:
- Buy Signal: In an uptrend, when the red channel line is positioned above the blue line and both remain below the price, it reflects sustained bullish momentum. A buying opportunity arises when the price pulls back to and rebounds from the red line, confirming support and the continuation of the upward movement.
- Sell Signal: In a downtrend, the red line stays below the blue line and above the price, indicating continued bearish sentiment. A selling opportunity emerges when the price retraces toward and bounces off the red line, acting as a dynamic resistance level.
- Potential Reversal Strategy:
- Bullish Reversal: Toward the end of a downtrend, if the red line breaks above the blue line, and a blue arrow appears on the chart, this combination suggests a potential bullish reversal, offering a timely long entry signal.
- Bearish Reversal: At the end of a bullish trend, when the red line crosses below the blue line and is followed by the appearance of a red arrow, this configuration signals a bearish reversal, providing a potential short-entry opportunity.
The iDouble Channel is most effective when used in conjunction with other forms of technical analysis, such as volume indicators, price action confirmation, or support and resistance zones. Its clear visual cues, combined with adaptive moving average logic, make it a valuable tool for both trend traders and reversal traders, enabling more confident decision-making across various market conditions and timeframes.
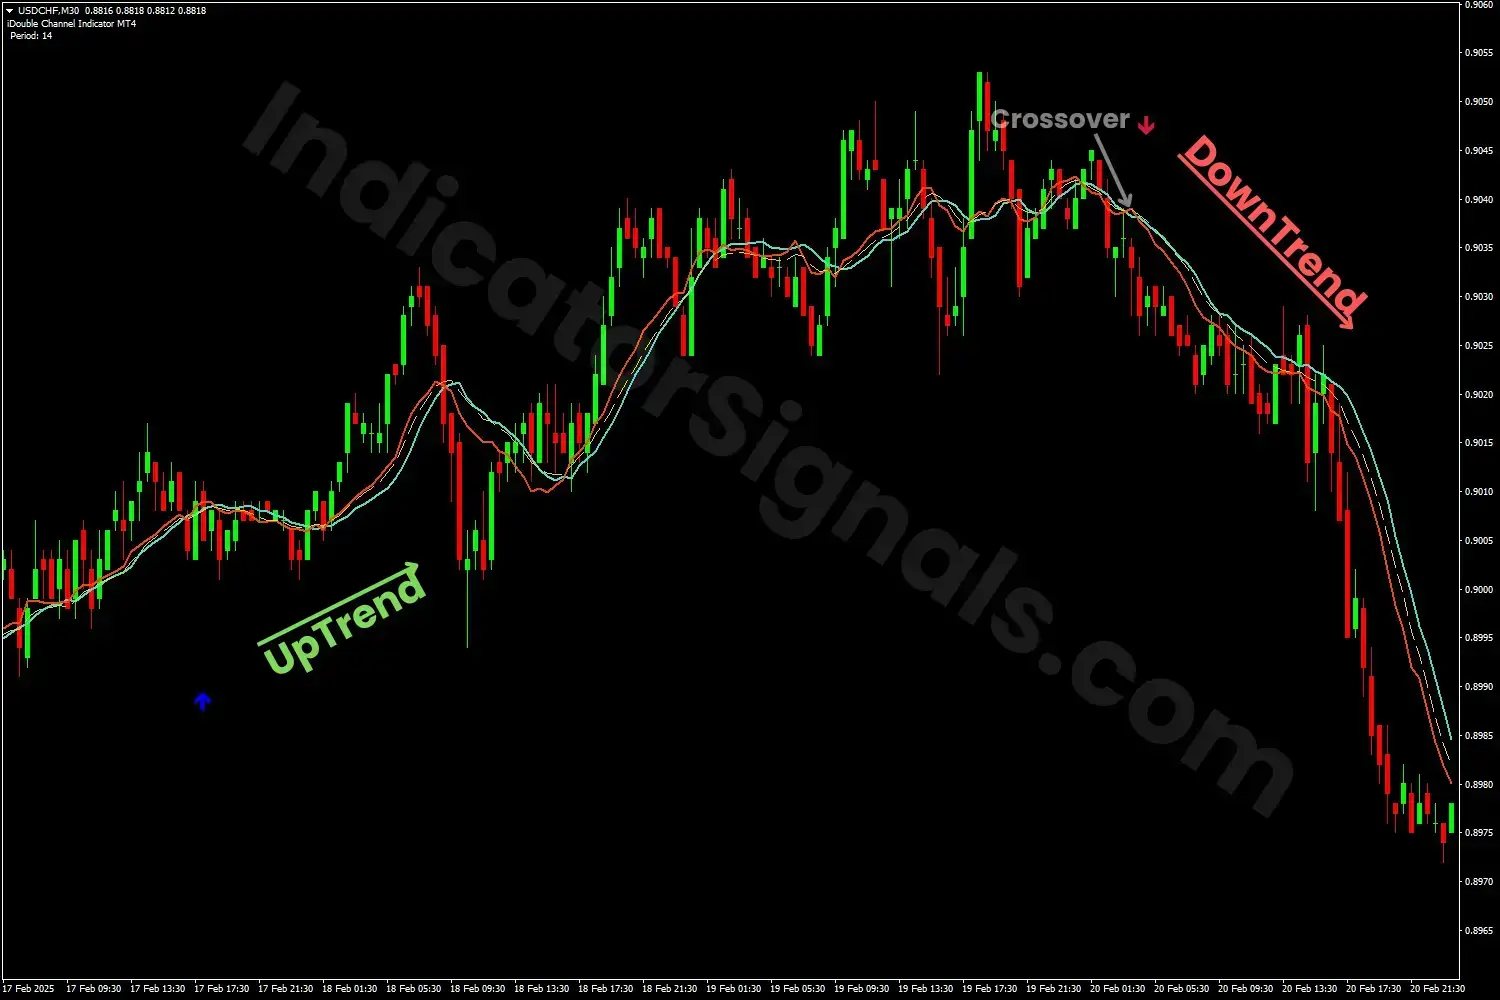
1- On the USDCHF chart, as displayed on MetaTrader 4, a blue arrow appears while the red line remains positioned above the blue line, indicating the start of a bullish trend. This alignment reflects strong upward momentum, and any rebound of the price from the red line, acting as a dynamic support level, may be interpreted as a secondary buy signal, allowing traders to scale into their position or secure additional profits within the prevailing uptrend.
As the trend progresses, the yellow middle line starts to flatten, suggesting a pause in momentum or a potential consolidation phase. Toward the end of the trend, the red line breaks below the blue line, accompanied by the appearance of a red arrow. This combination signals a bearish reversal, providing a strong sell opportunity as the trend shifts direction.
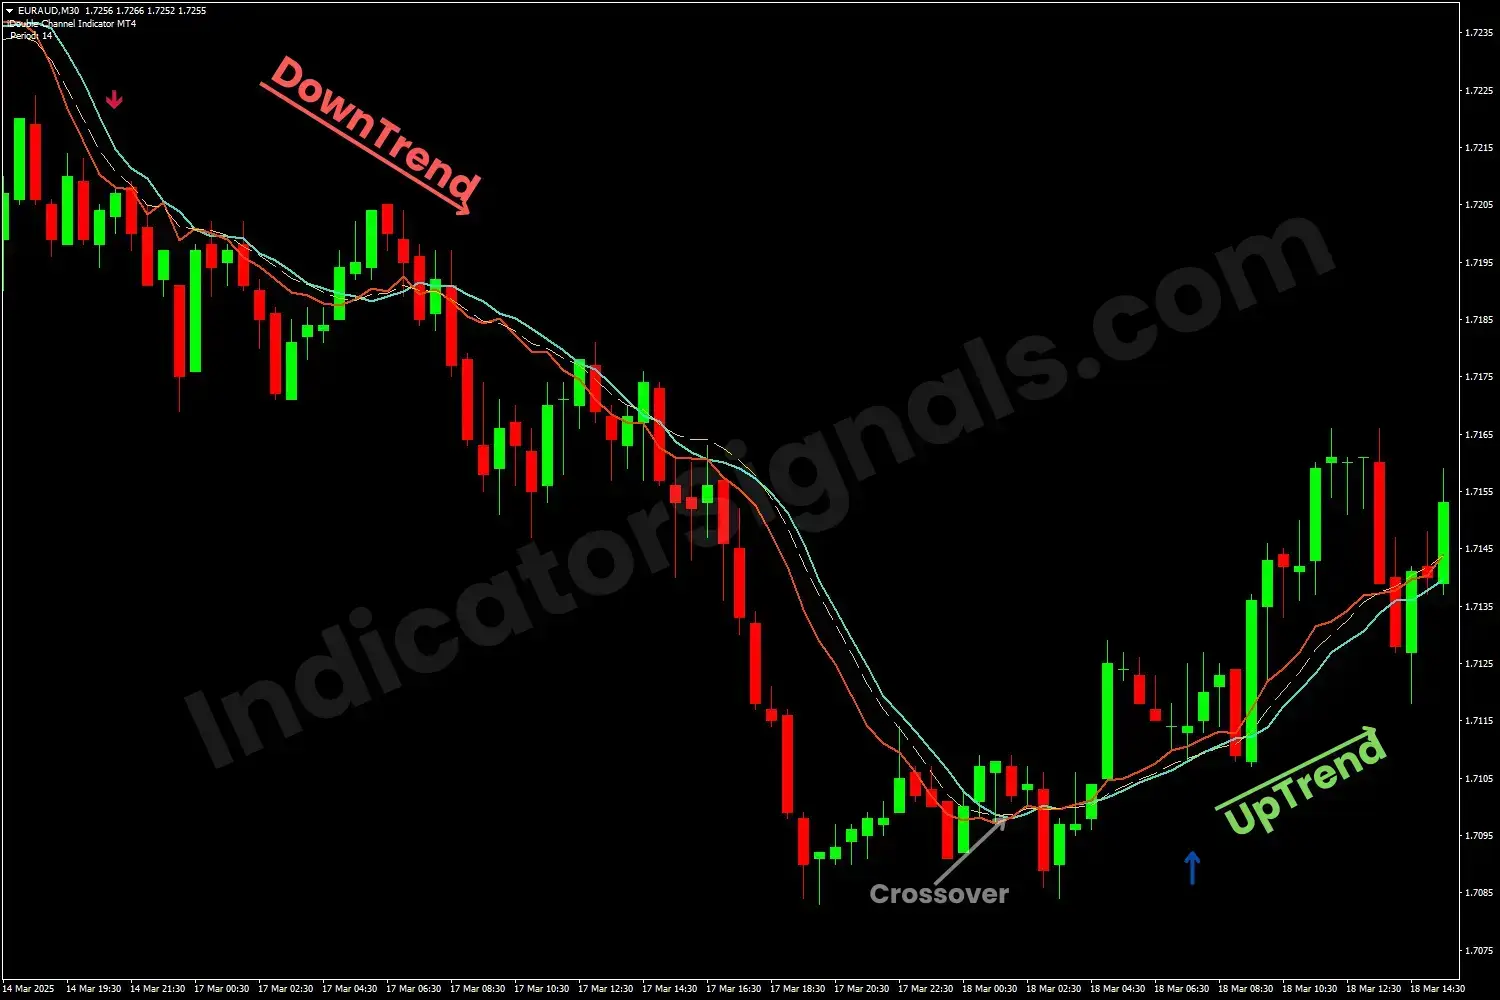
2- On the EURAUD chart, as seen on MetaTrader 5, the indicator prints a red arrow, highlighting the beginning of a bearish trend. With the red line staying below the blue line and the price consistently moving lower, the indicator confirms the continuation of downward momentum. In such conditions, price rebounds from the red line, now acting as a dynamic resistance, may be viewed as additional short-entry opportunities.
Later, the indicator signals a possible bullish reversal when the red line crosses above the blue line, accompanied by the emergence of a blue arrow. This shift in structure, supported by all three components (line crossover, arrow, and price behavior), confirms the transition into an uptrend, offering traders a timely long entry point to capitalize on the market reversal.
IndicatorSignals.com - Owned & Operated By
FINANSYA LAB
|
2026 © All Rights Reserved.


