Version:
1.0
Updated:
11 April 2025
Downloads:
0
The Ichimoku Kinko Hyo is a complicated technical analysis indicator on MetaTrader 4 that simultaneously displays support and resistance levels, trend direction, and momentum through five lines: Tenkan-sen, Kinjun-sen, Senko Span A, Senko Span B, and Chikou Span. Also available on the MT5 platform, this multi-functional indicator enables traders asses market direction and strength, identify buy and sell signals, and detect potential trend reversals.
The Ichimoku Kinko Hyo (IKH), developed by Goichi Hosoda, is a trend-following indicator that provides a complete view of the market, combining trend direction, momentum, and support and resistance levels in the Metatader charts.
The IKH comprises five key components:
- TenKan-sen (Red Line): Short-term trend.
- Kijun-sen (Blue Line): Medium-term trend.
- Senkou Span A (White Cloud): Midpoint between Tenkan and Kijun, forming one edge of the Kumo.
- Senkou Span B (Orange Cloud): 52-period high-low average, forming the other edge of the Kumo.
- Chikou Span (Lime Line): Closing price plotted 26 periods back, indicating momentum.
Moreover, this indicator helps traders in several trading strategies, such as:
- Market direction:
- When the price trades above the bullish Kumo (orange) but remains below the Lime line, while the Red line moves above the Blue one, it indicates a potential bullish trend and a buying opportunity.
- When the price drops below the bearish Kumo (white) but stays above the Chikou span line, at the same time, the short-term falls below the medium-term line, it suggests a potential bearish trend and a short opportunity.
- When the price is tapped within the Kumo, with no clear direction and the Tenkan-sen and kijun-sen moving sideways, it signals a consolidation phrase.
- Trend reversals:
- If the price rises above the kumo, with the breaks of the red line above the blue line, it signals a potential bullish reversal.
- If the price falls below the kumo, with the breaks of the red line below the blue line, it signals a potential bearish reversal.
- Kumo Breakout and Trend continuation:
- When the price closes above the Kumo, and the cloud ahead is bullish (Orange), it confirms upward movement.
- When the price closes below the kumo, and the cloud is bearish (White), it suggests downward momentum.
By mastering its components, traders can make informed trade decisions and improve their market timing, making it a valuable tool for novice and experienced traders.
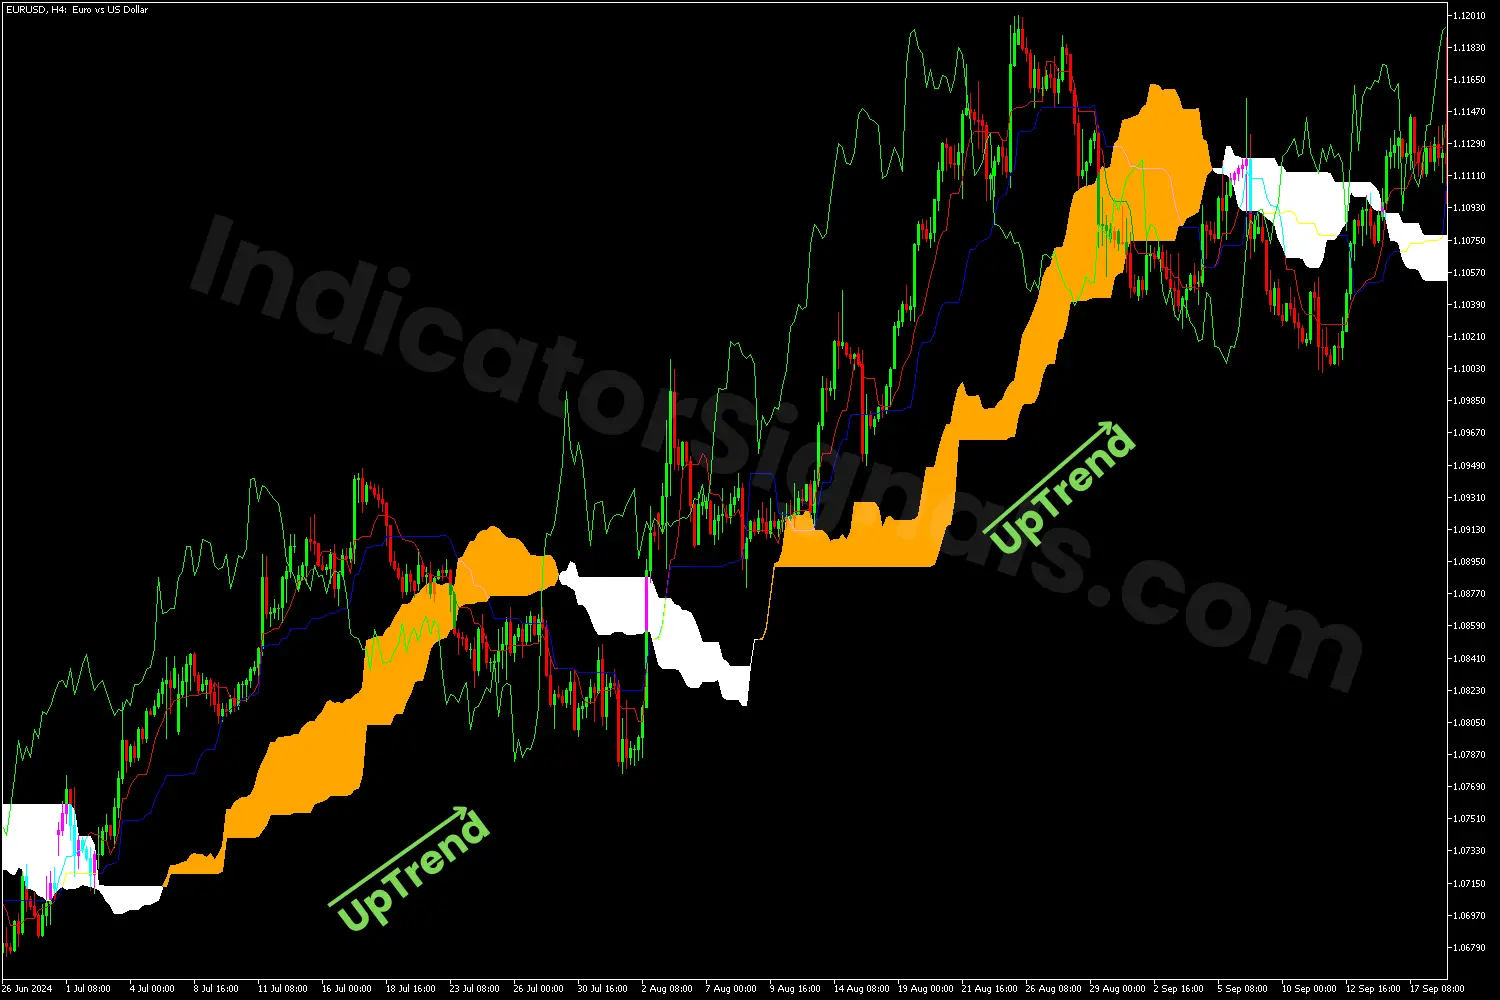
1- In the first trading chart example on MT4, during an uptrend, the price remains above the bullish Kumo (orange), with the Red line (Tenkan-sen) positioned above the Blue line (Kijun-sen), while the price stays below the Lime line (Chikou Span), all confirming the strength of the bullish trend. Although a brief decline occurs, it signals a potential reversal, but the price subsequently rises again, reinforcing the continuation of the upward trend and signaling a long entry in the EURUSD pair.
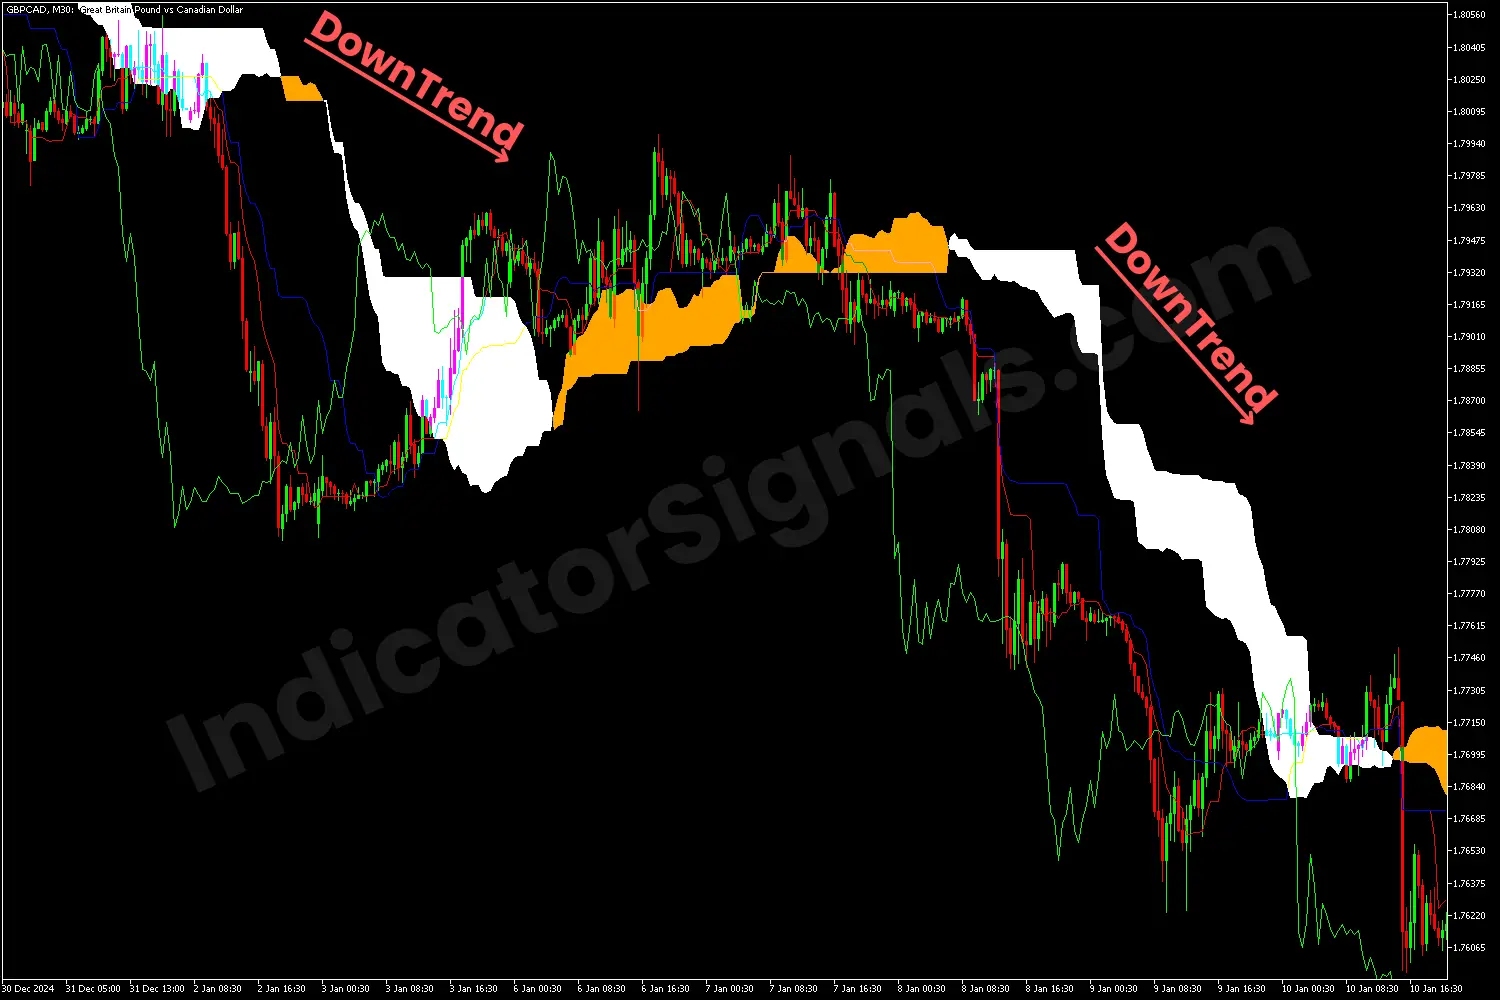
2- In the second trading chart example on MT5, during a downtrend, the price remains below the bearish Kumo (white), with the short-term line (Tenkan-sen) positioned below the miduim-term line (Kijun-sen), while the price remains aove the Chikou Span line, all confirming the strength of the bearish trend. Although a brief increase occurs, it signals a potential reversal, but the price falls again, reinforcing the continuation of the downward trend and signaling a short entry in the GBPCAD pair.
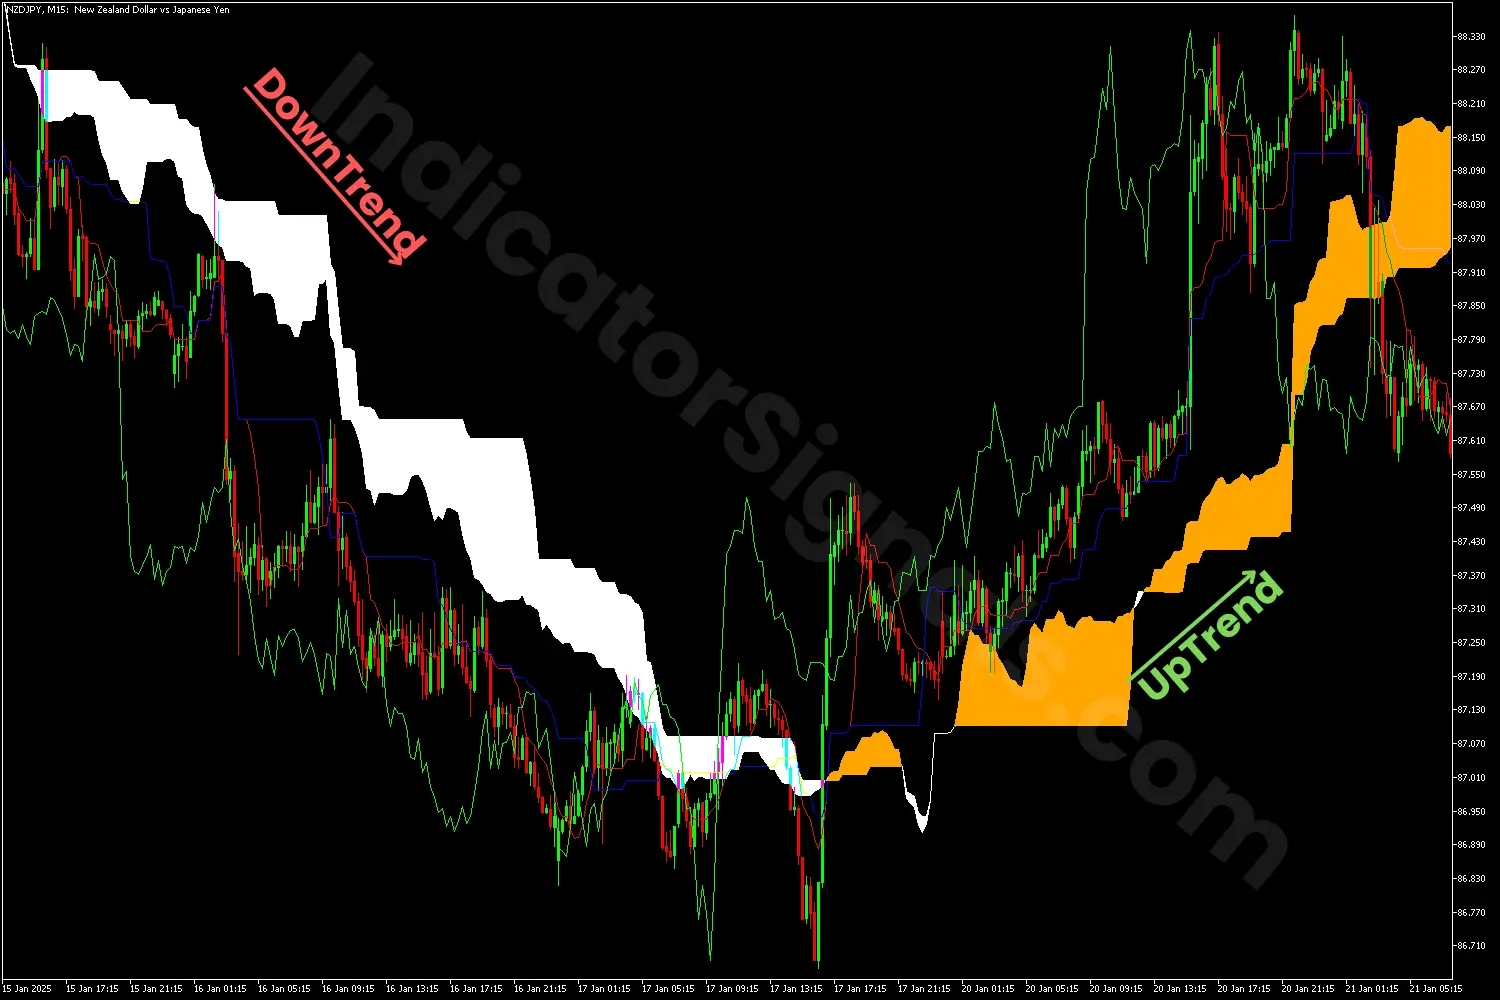
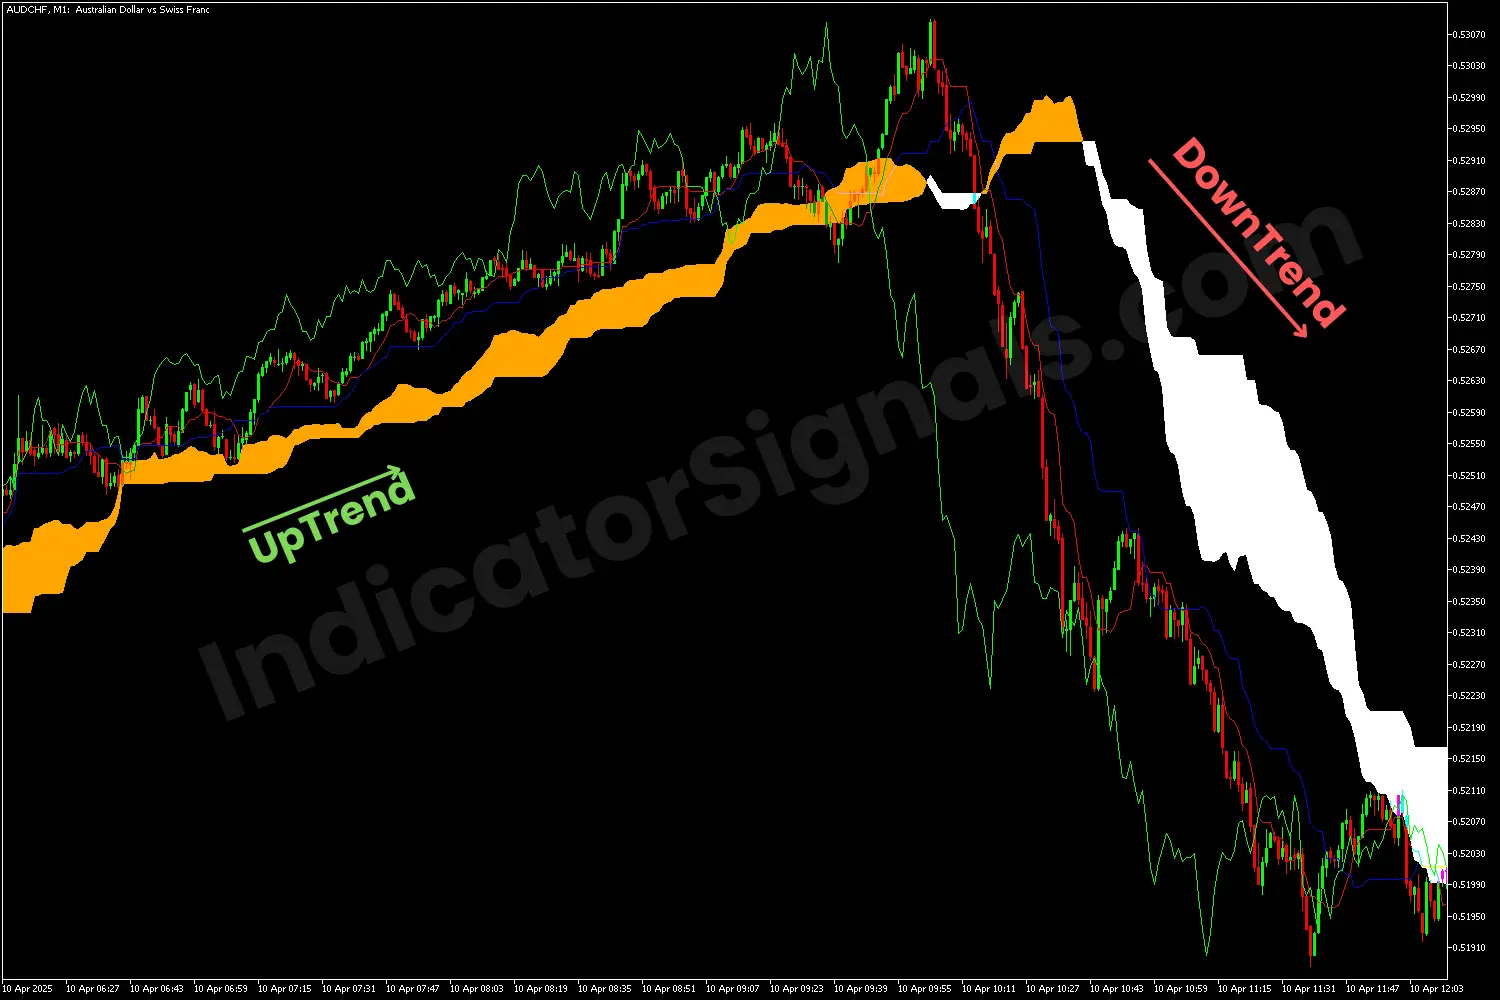
3- In the third trading example on the MetaTrader 4 chart, at the peak of the bullish trend, a price decline occurs, confirmed by the emergence of a bearish Kumo (cloud). However, the price recovers briefly. When the price falls below the previous support (represented by the white Kumo), it signals the onset of a bearish trend, indicating that traders should exit their long positions and consider entering short.
4- In the last trading example on the MetaTrader 5 chart, at the bottom of the bearish trend, the price rises, confirmed by the emergence of a bullish Kumo (cloud). However, the price recovers briefly. When the price falls below the previous resistance (represented by the orange Kumo), it signals the start of a bullish trend, indicating that traders should exit their short trades and consider entering long.
IndicatorSignals.com - Owned & Operated By
FINANSYA LAB
|
2026 © All Rights Reserved.
