Version:
1.0
Updated:
25 February 2025
Downloads:
1
The Hull Moving Average Indicator for MT4 and MT5 is a trend-following indicator that was developed in early 2000s (Around 2005-2006) by the Australian quantitative analyst and fund manager “Alan HULL”. The indicator was developed to bypass the lagging issue in moving averages while maintaining the most accurate possible results. This metatrader indicator tracks the trend and detects its current path and any signs of reversal patterns that could alter the path of the current trend by giving visual warnings while staying highly customizable based on users’ preferences.
The Hull Moving Average Indicator is a trend-following indicator that aims to reduce the lag associated with traditional moving averages. It provides a smoother version of the conventional moving averages while keeping and granting high-accuracy results.
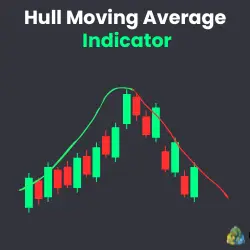
The indicator displays on the Metatrader charts a colored moving average line that switches colors based on current trends. The indicator is calculated using the traditional moving averages principles while adding weight to smooth fluctuations. It works on every timeframe available and for every tradable asset. traders, investors, and scalpers generally use it to detect early signs of reversal.
In addition, traders, investors, and scalpers also use it for confirmation purposes alongside other indicators. Furthermore, this metatrader indicator is, most of the time, referred to as HMA Indicator. The indicator gives more weight to recent price changes as it helps smooth out short-term fluctuations while having a standard lookback period of 14 periods that is always eligible for changes depending on users’ strategy and preferences.
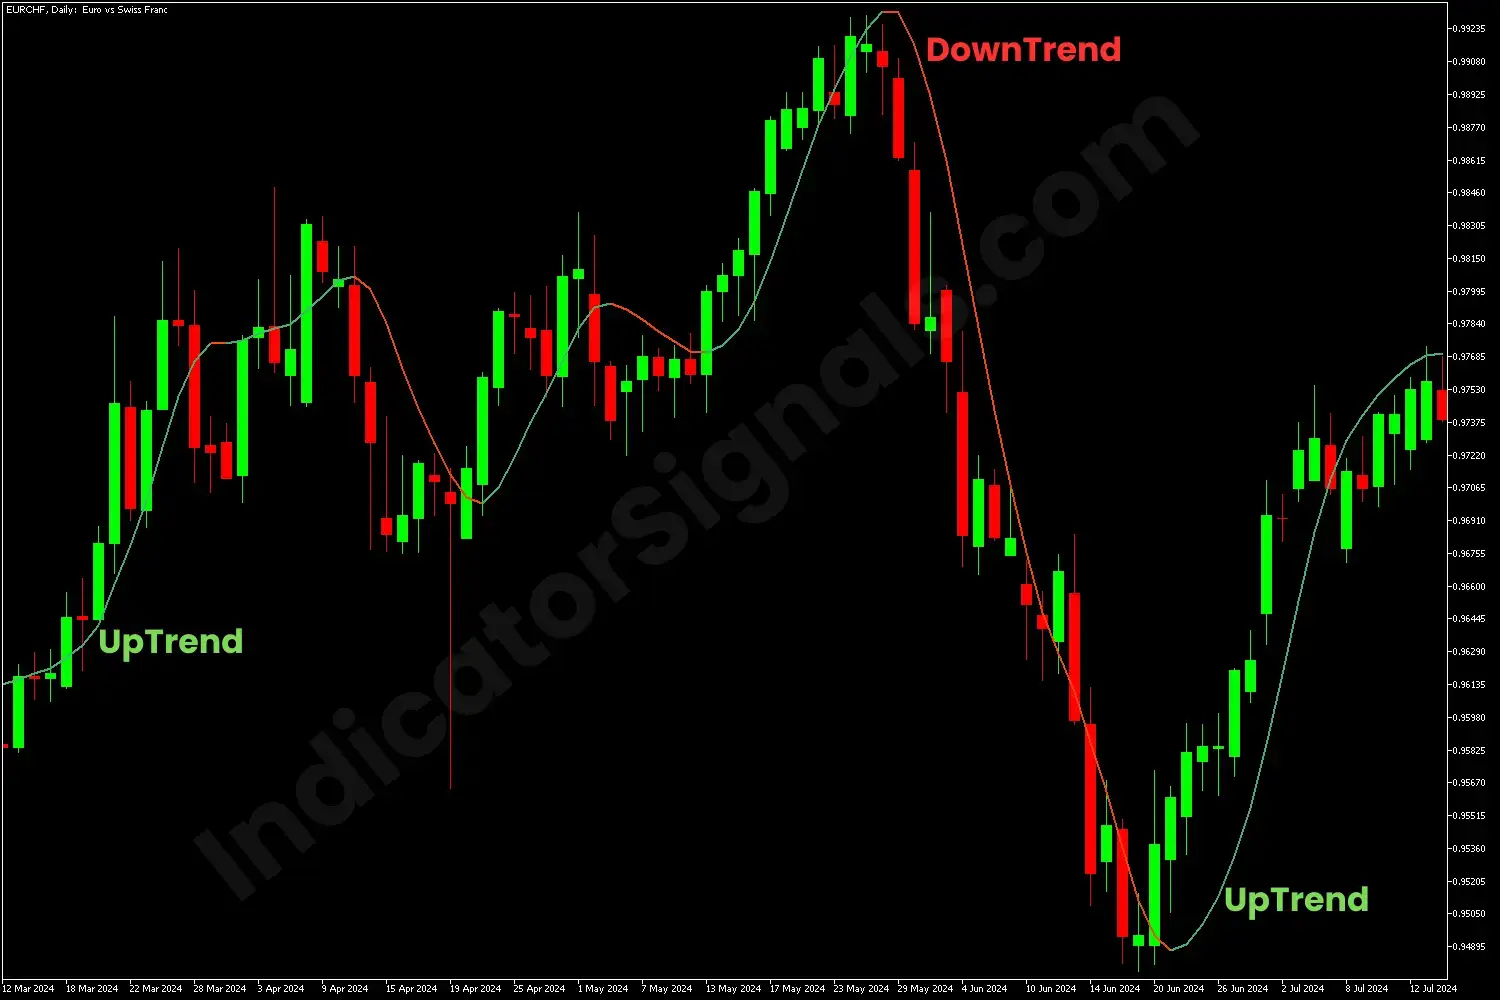
Trading using the Hull Moving Average Indicator is easy for experienced and newbie traders. The indicator displays a smoother Moving Average line that changes color based on the current trend. Per default, the line turns green during an uptrend and red during a downtrend. However, this color scale is customizable based on the user’s preferences.
Also, the look-back period is per default 20 and could be customized based on the user’s strategy and goals. As a rule of thumb, traders should enter the market, go long on the asset, or close their short position as soon as the line turns green as the price may rise exponentially. However, if the line turns red, traders should go short or exit their position as it is an indication of the start of a downtrend.
IndicatorSignals.com - Owned & Operated By
FINANSYA LAB
|
2026 © All Rights Reserved.


