Version:
1.0
Updated:
21 April 2025
Downloads:
3
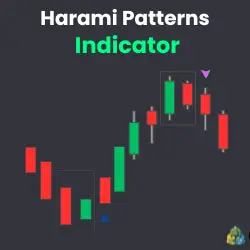
The Harami Patterns Indicator for MetaTrader 5 is designed to automatically detect bullish and bearish harami candlestick formations in real-time trading. Also available on the MT4 platform for FREE, this indicator enables traders identify potential market reversals by highlighting these price action patterns directly on the chat, helping them determine entry and exit points.
The Harami Patterns Indicator is a specialized candlestick pattern recognition designed to detect Harami patterns on the chart, using distinct arrows for each type: a magenta arrow marks bearish Harami setups, while a blue arrow highlights bullish Harami formations.
In general, the harami patterns consist of two candles:
- The first candle is typically large, reflecting strong momentum in the direction of the trend.
- The second is smaller, with both its open and close contained inside the previous candle's body.
However, this indicator hemps traders spot potential bullish or bearish reversals based on the two types of harami patterns:
- Bullish Harami: Occurs during a downtrend. The first candle is bearish followed by a smaller bullish candle that opens and closes within the range of the first candle's body. This suggets that sellers are losing strength, and traders should look for long entry.
- Bearish Harami: Found near the end of a bullish trend. The first candle is bullish followed by a smaller bearish one that fully contained within the first. This indicates potential weakness among buyers and a possible downtrend reversal.
Furthermore, the indicator automatically identifies all Harami patterns on the chart. For optimal results, traders are advised to focus on patterns that appear near the end of a prevailing trend, whether bullish or bearish. It's also recommended to confirm these signals using additional forms of technical analysis, such as trend indicators, oscillators, or support and resistance levels, to minimize the risk of false signals.
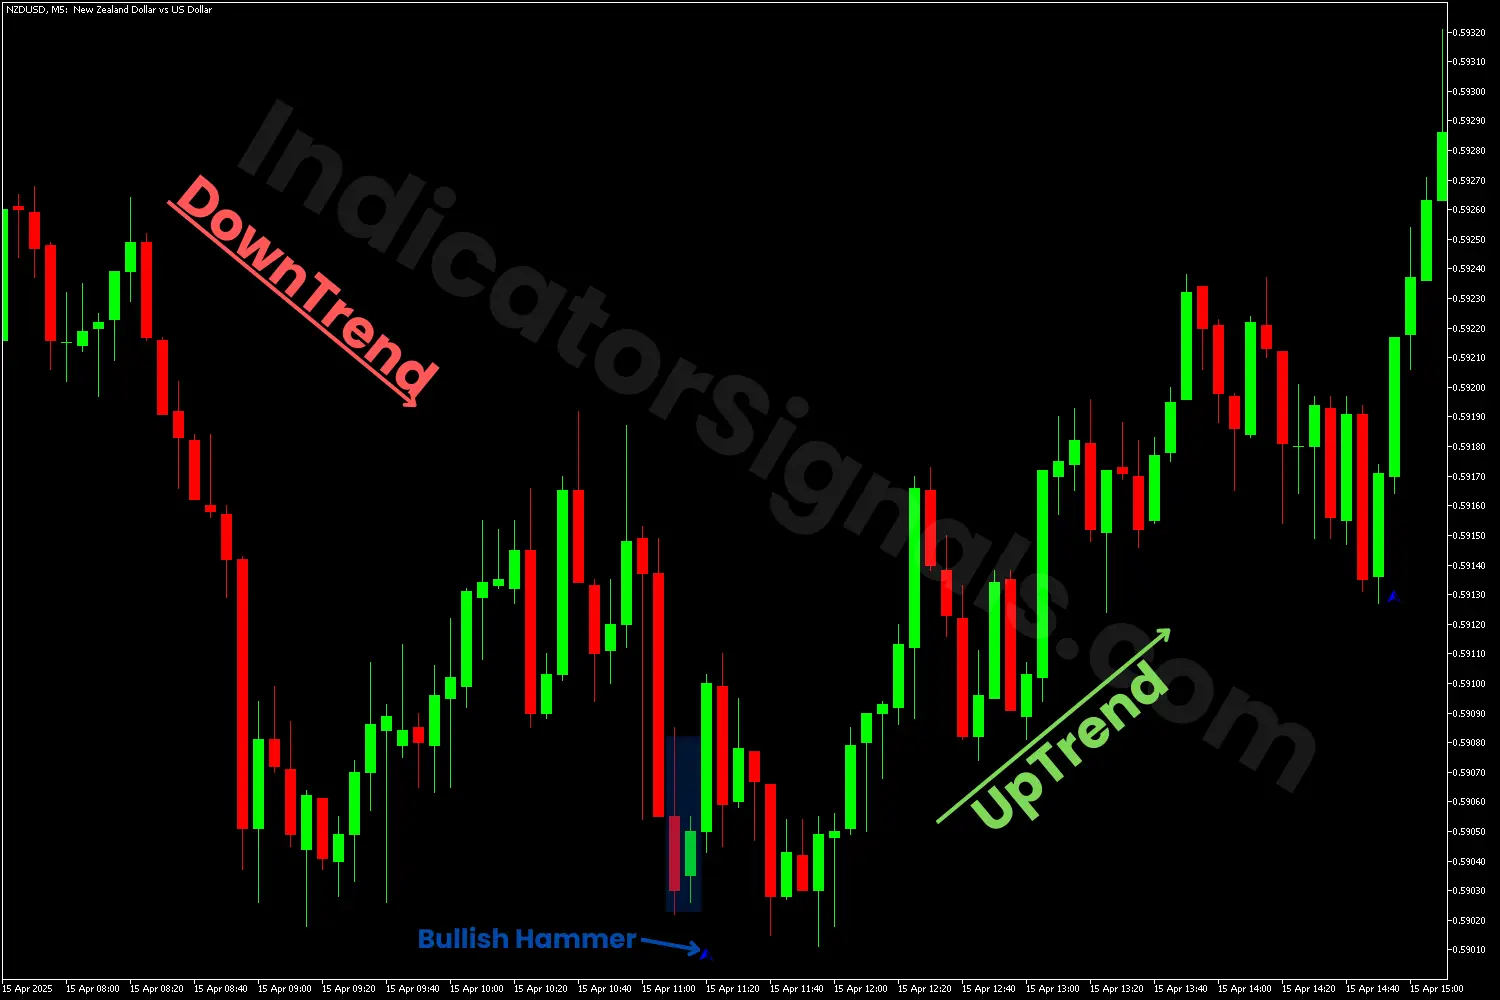
1/ In the first trading example, using the MT4 version of the Harami Patterns Indicator, a blue arrow appears near the end of a downtrend, signaling the detection of a bullish Harami pattern. This setup is formed by a large red candle representing strong bearish momentum, followed by a smaller green candle that opens and closes within the body of the previous candle.
This formation indicates weakening selling pressure and the potential for a bullish reversal. As demonstrated on the NZDUSD chart, the market did indeed reverse to the upside. In such scenarios, traders are advised to close short positions upon the appearance of the blue arrow and consider entering a long trade after confirming the signal with additional technical analysis indicators to ensure a higher probability setup.
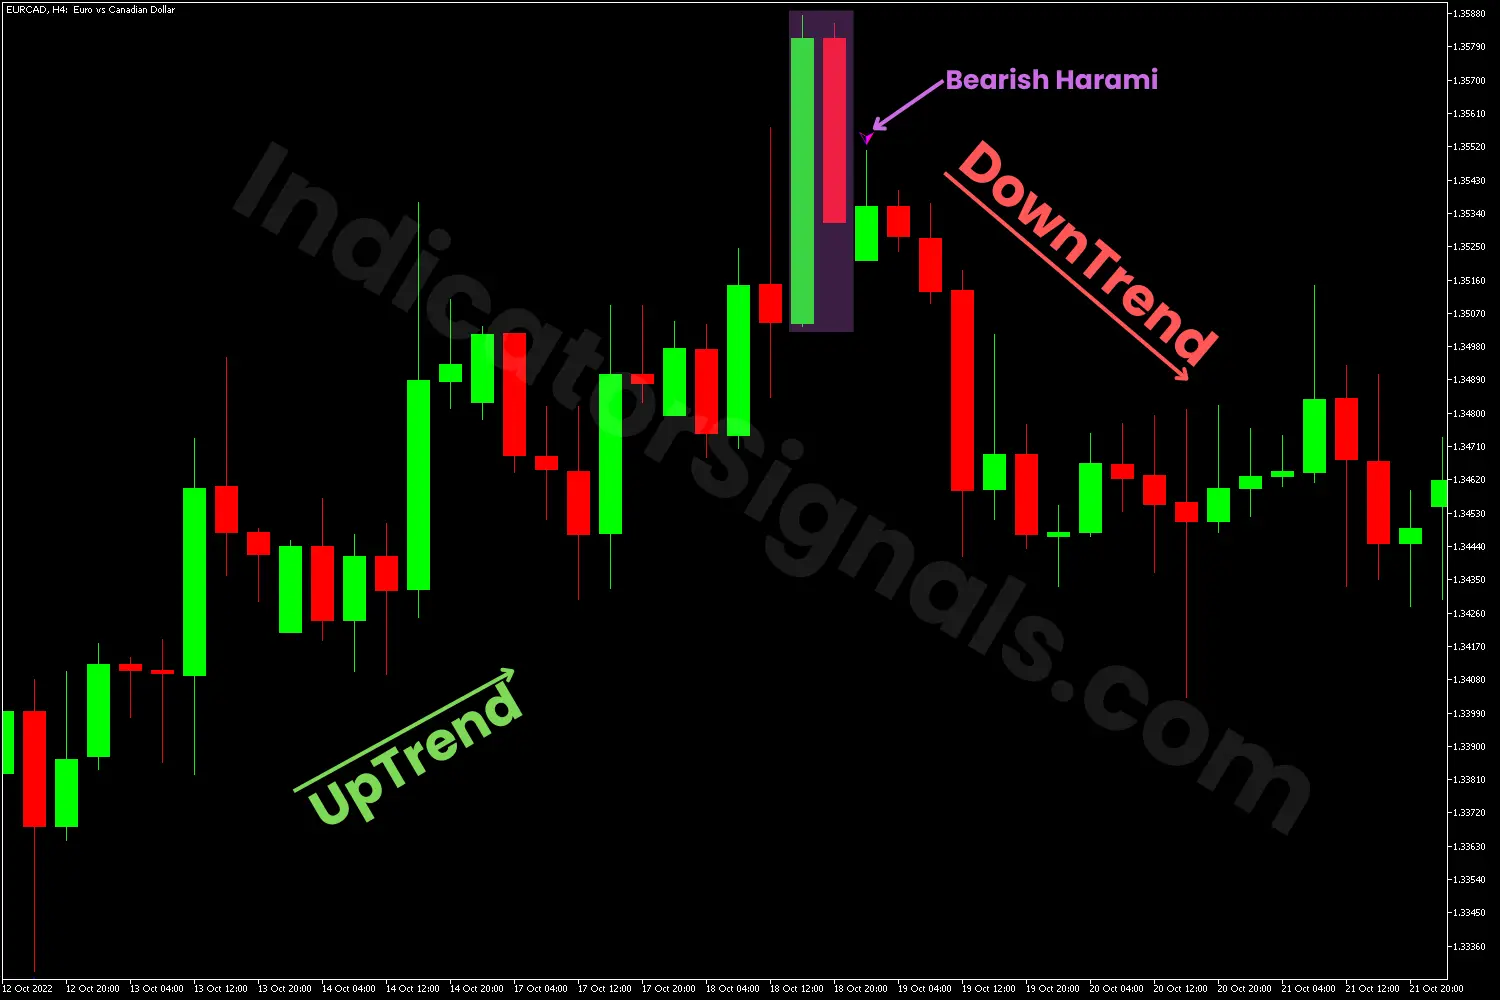
2/ In the second trading example, using the MT4 version of the Harami Patterns Indicator, a magenta arrow appears near the end of an uptrend, signaling the detection of a bearish Harami pattern. This setup is formed by a large lime candle representing strong bullish momentum, followed by a smaller red candle that opens and closes within the body's range of the previous candle.
This formation indicates that buyers are losing strength and a potential bearish reversal may occur. As shown on the EURCAD chart, that is exactly what happened. In such situations in a real-time trading, traders are advised to close long trades with the appearance of the bearish arrow and consider entering short after confirming the signal with additional technical analysis indicators to avoid false signals.
IndicatorSignals.com - Owned & Operated By
FINANSYA LAB
|
2026 © All Rights Reserved.


