Version:
1.0
Updated:
25 February 2025
Downloads:
6
The Gain/Loss Info Indicator on MetaTrader 4 calculates the percentage and pip difference by comparing the current candle to the previous candle's close or open. Applying this indicator to an MT5 chart enables traders to quickly assess market momentum and direction by identifying the last gains or losses from the previous candles and anticipating the potential gain or loss of the current candle.
The Gain/Loss Info indicator is classified as a trend-following indicator designed to measure price movements in both pips and percentage terms by comparing the close of the current candle to the close or the open of the previous one. These settings can be adjusted based on the trader's preferences and trading strategy.
Furthermore, this indicator can be used to identify trend strength and potential reversals and to confirm breakouts, allowing traders to make quick and informed trading decisions. Here is the explanation of each strategy:
- Trend confirmation:
- If the G/F indicator shows consistent gains in an uptrend, it confirms bullish momentum, and if it presents consistent losses, it indicates bearish movements.
- Potential reversals:
- A declining gain percentage or pips during an uptrend may signal a potential reversal to a downtrend, and the inverse is true.
- Breakout:
- When the G/L presents an increase in gains or losses near resistance or support levels, respectively, it confirms a strong breakout.
- A low gain or loss value may suggest a false breakout or consolidation.
- Volatility:
- If this indicator presents an important loss or gain candle during an uptrend or downtrend, it may indicate a high volatility, signaling a potential reversal or a continuation of the trend. If not, it may indicate a consolidation phase.
To help you understand how to use the Gain/Loss Info indicator, I will explain its utility with four different scenarios and how to adapt its settings for each trading strategy, whether for swing traders or scalping.
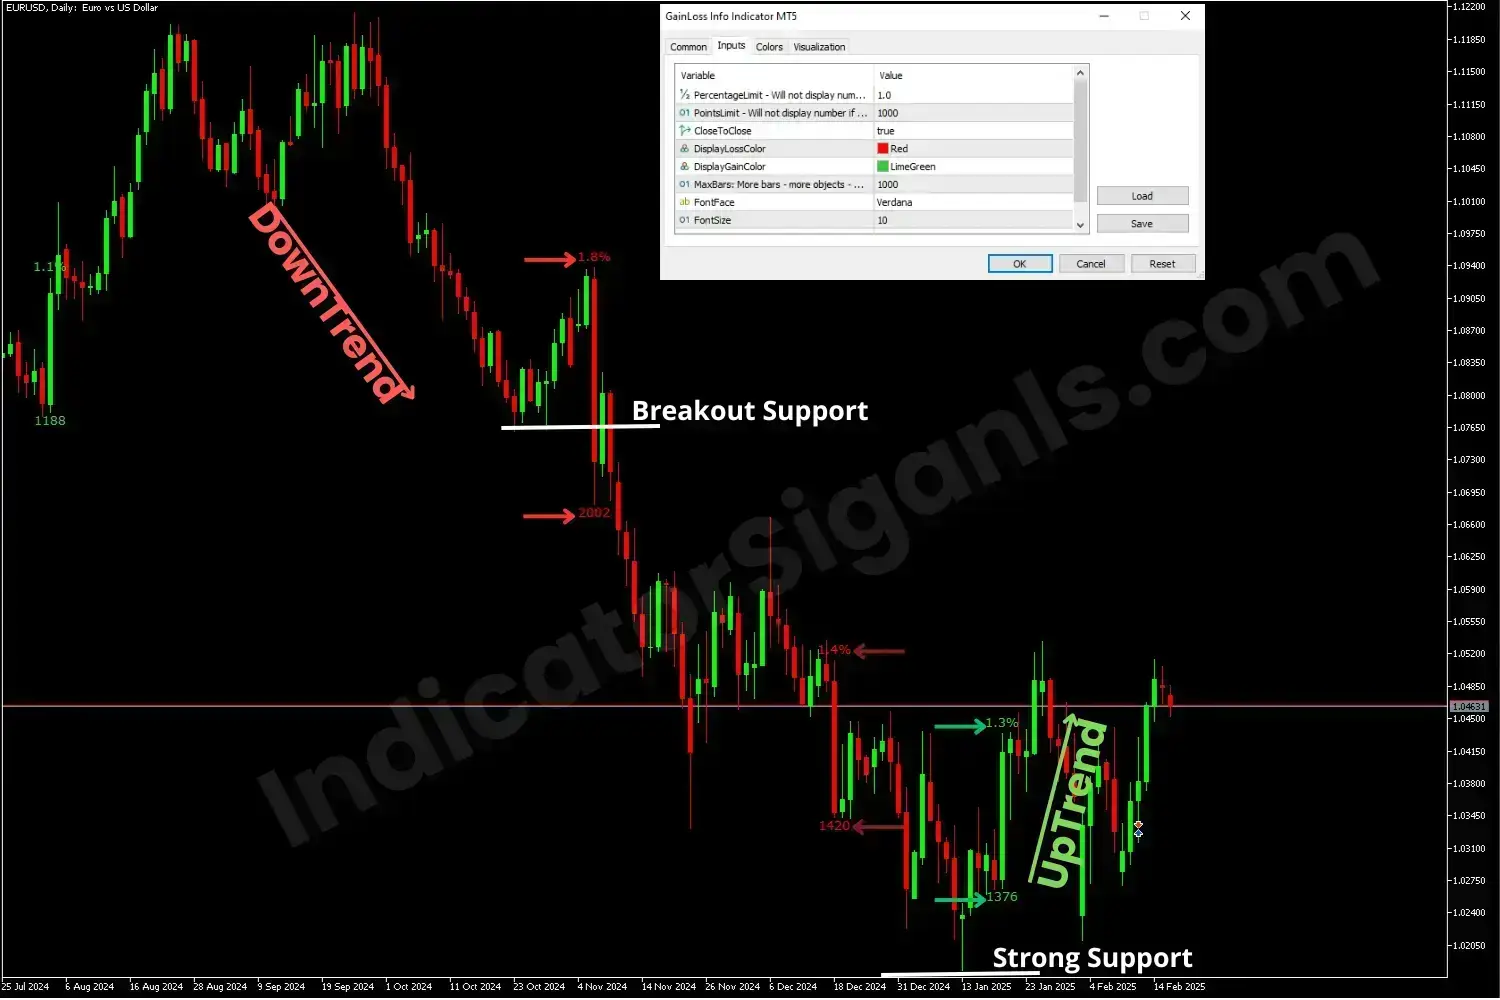
In the EURUSD chart example on MT4, Daily timeframe, I kept the default settings with a 1% percentage limit and a 1000 pip close to close limit. During the downtrend, the indicator confirmed trend continuation by displaying red pips and percentage values as the price broke below the last support level. However, in the next loss display, the decline weakened (1.4% < 1.8%), signaling a potential reversal. Toward the end, the price rebounded from the support line, and the indicator confirmed the beginning of a bullish movement by turning green in both pips and percentage values.
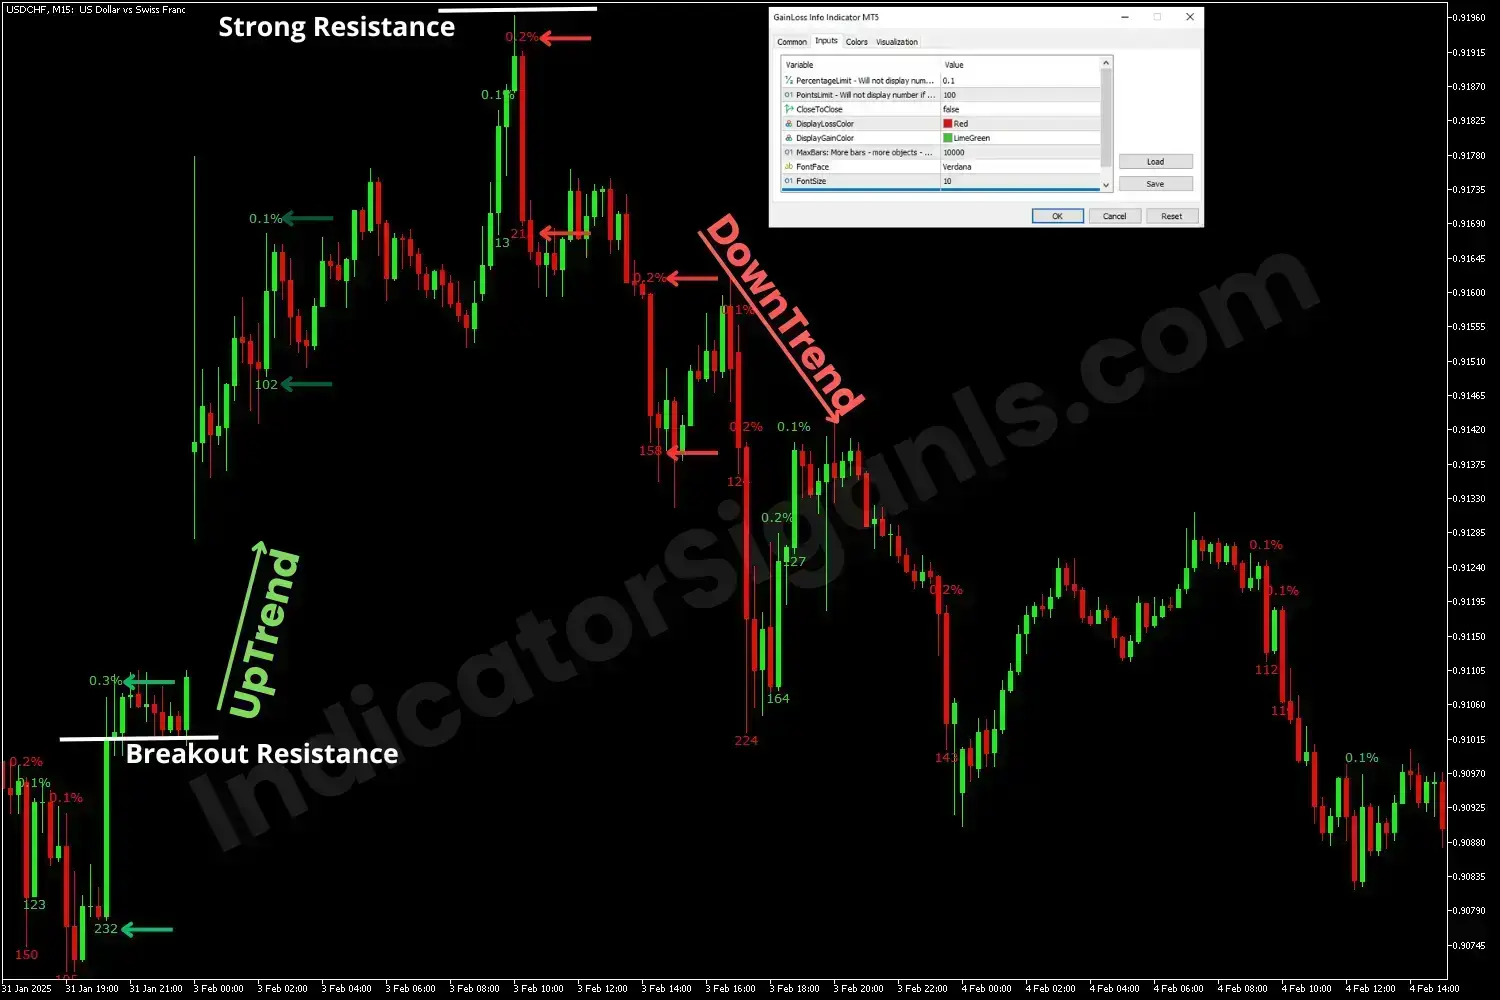
In the USDCHF chart example on MT5, M15 timeframe, I change the setting to 0.1% percentage and a 100 pip close to open limit. During the uptrend, the G/L indicator confirmed trend continuation by displaying green pips and percentage values as the price broke above the last resistance level. Furthermore, in the next gain display, it's losing strength compared to the previous one (0.1% < 0.3%), signaling a potential reversal. Near the end, the price bounces off the resistance level, and the indicator confirms the start of a bearish momentum by turning red in both pips and percentage values.
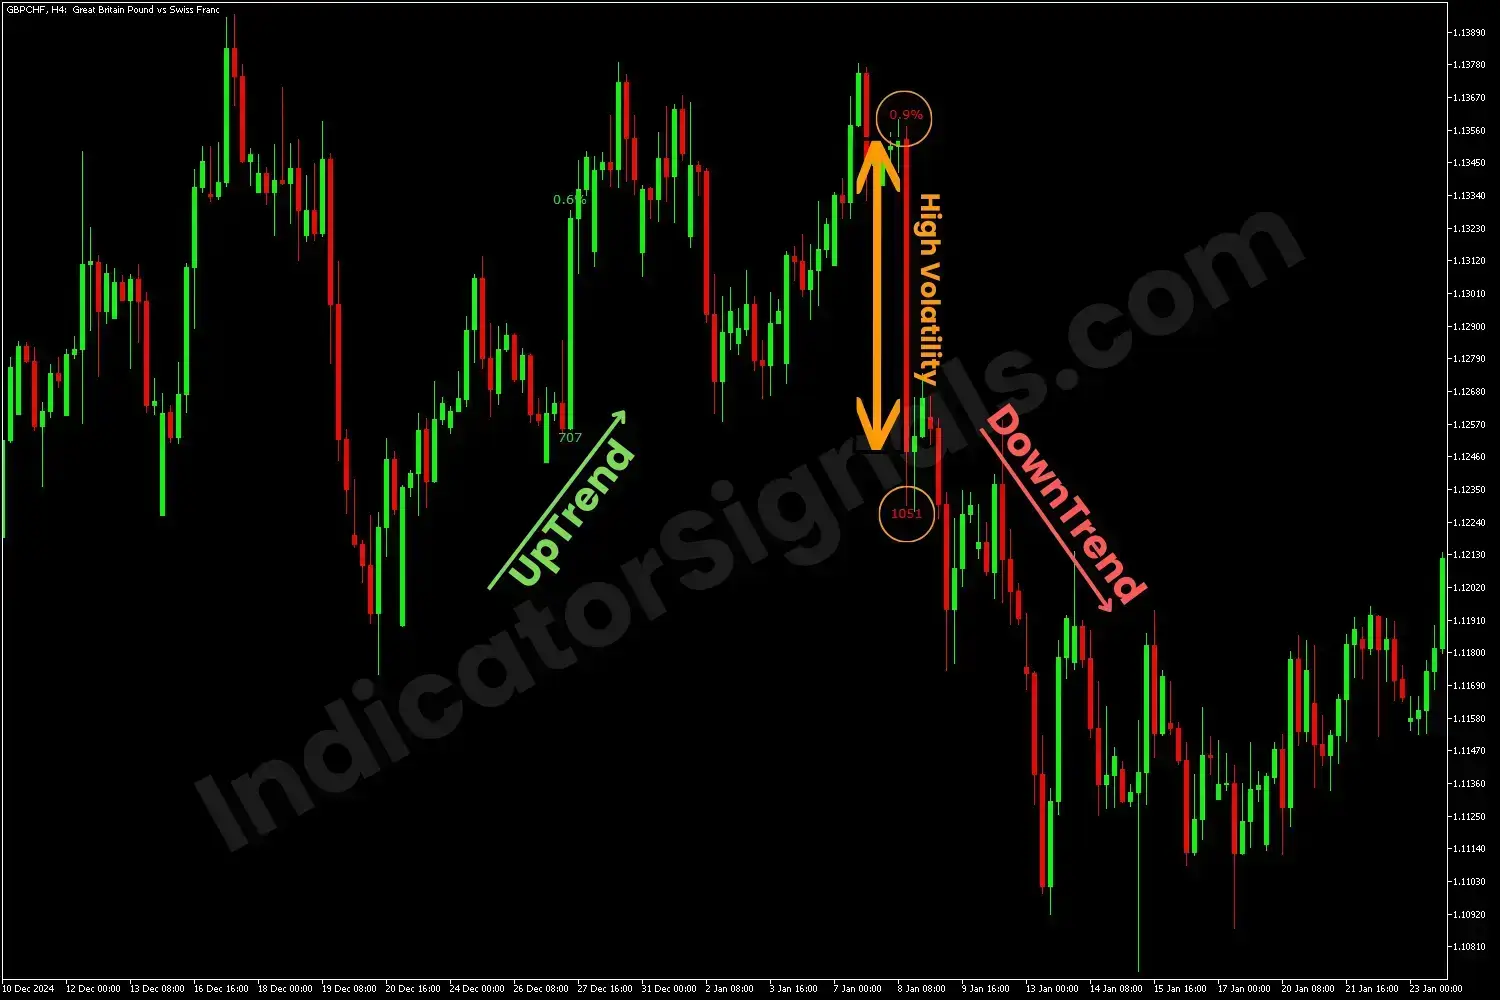
In the GBPCHF chart example on MT4, H4 timeframe, during an uptrend, and by applying the G/L indicator, it doesn't indicate any loss or gain candle, that showing a consolidation phase in the market, until a high volatility bearish candle showing up, with 0.9% and 1051 loss, signaling the reversal of the trend, indicating a selling opportunity for the trader.
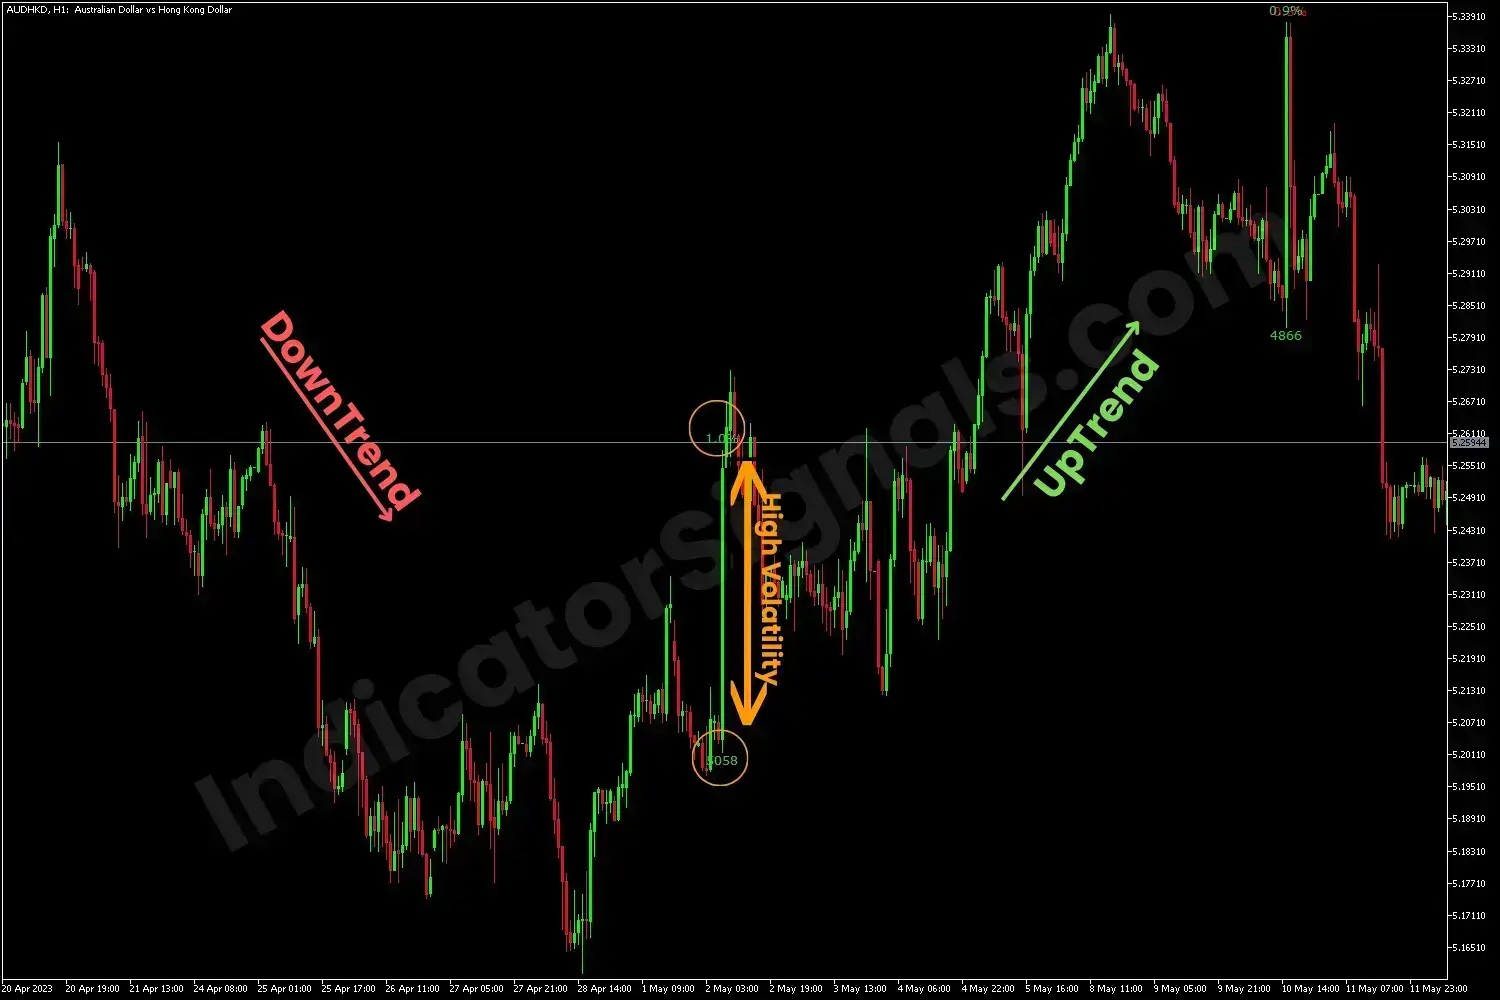
In the AUDHDK chart example on MT5, H1 timeframe, during a downtrend, and by executing the G/L indicator, it doesn't indicate any loss or gain candle, that showing a sideways market condition, until a high volatility bullish candle showing up, with 1% and 5058 gain, signaling the reversal of the downtrend, indicating a buying opportunity for the trader.
IndicatorSignals.com - Owned & Operated By
FINANSYA LAB
|
2026 © All Rights Reserved.
