Version:
1.0
Updated:
13 May 2025
Downloads:
7
The Fractals Indicator for MetaTrader 4 is a price action tool used to identify potential reversal points in the market. Also available on the MT5 platform, this indicator highlights short-term highs and lows, helping traders spot key support and resistance levels, define trend direction, and improve timing for entries and exits.
The Fractals Indicator is a technical analysis tool developed by Bill Williams, designed to detect turning points in price action. It highlights short-term tops and bottoms in the market structure, making it easier for traders to recognize potential trend reversals or breakout levels.
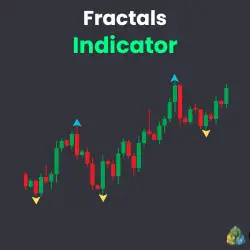
On MetaTrader charts, the Fractals Indicator appears as arrows (or triangles) above or below candlesticks:
- Upward fractals (Blue) appear above a central candle with two lower highs on each side, marking a potential local high or resistance level.
- Downward fractals (Yellow) appear below a central candle with two higher lows on each side, marking a potential local low or support level.
However, these signals do not repaint and remain fixed once confirmed, making them reliable for:
1- Trend Identification:
- A series of higher upward and downward fractals indicates an uptrend.
- A series of lower upward and downward fractals indicates a downtrend.
2- Entry Setups:
- Traders may enter long positions when the price breaks above the most recent upward fractal.
- Short positions may be considered when the price breaks below the most recent downward fractal.
While the Fractals Indicator is simple, it’s most effective as part of a broader trading system. It helps traders avoid false breakouts and supports disciplined decision-making based on visible price structure.
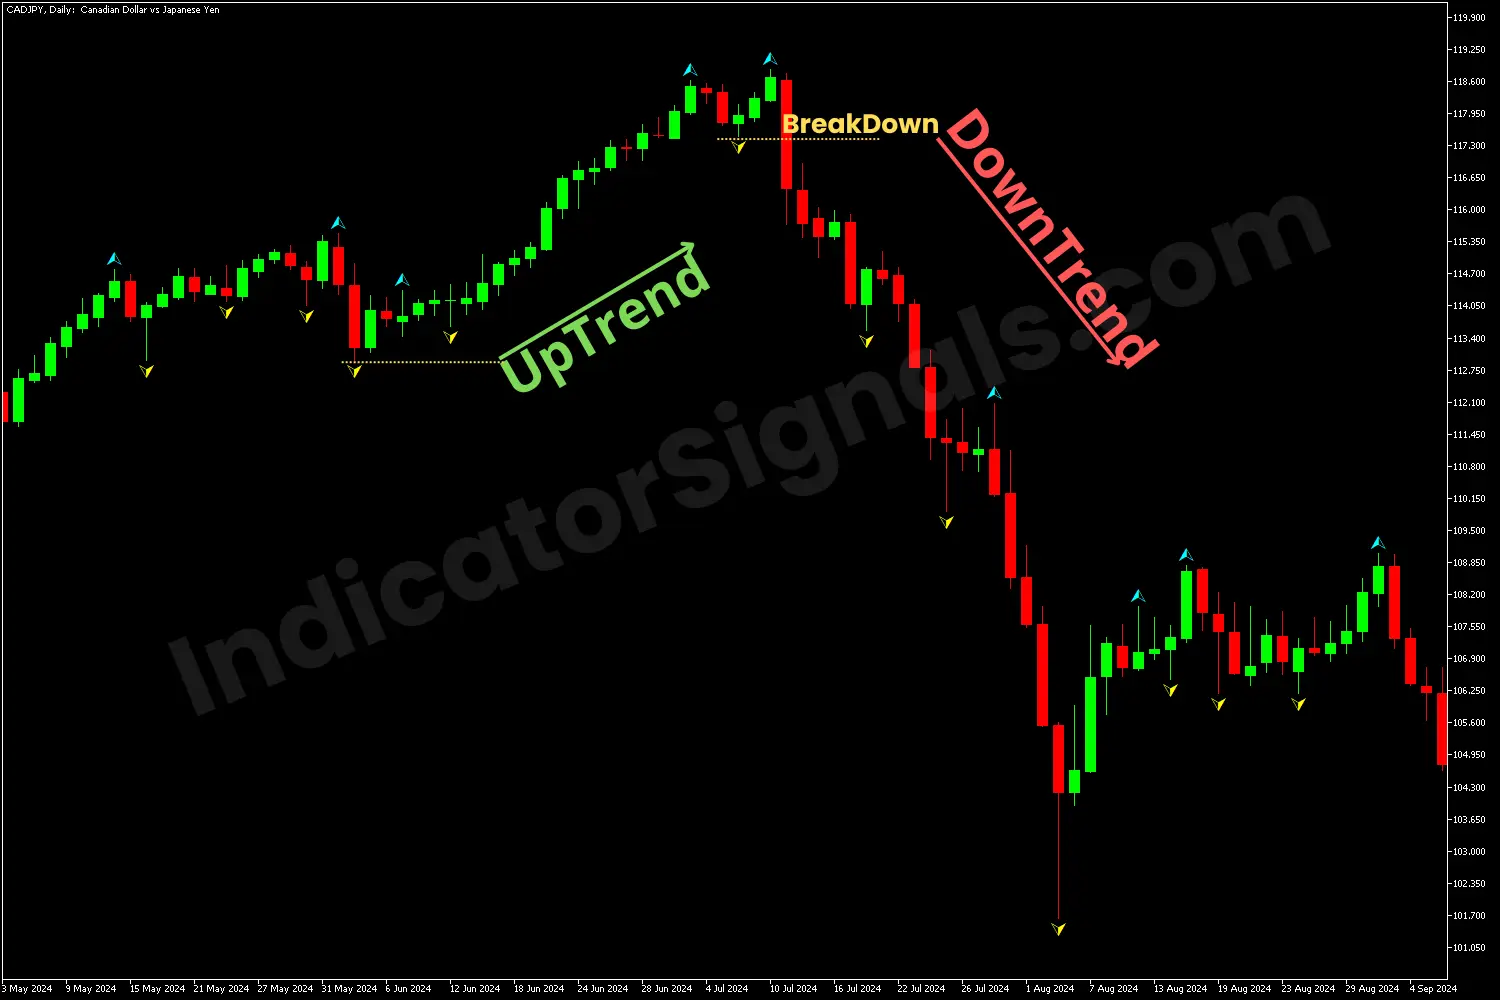
1- In the CADJPY chart example, after applying the Fractals indicator on MetaTrader 5, it confirmed the continuation of the uptrend. This was shown by the price rebounding from the most recent downward fractal and forming a series of higher bullish and bearish fractals as the trend progressed.
Toward the end of the trend, the price dropped below the most recent upward (yellow) fractal, accompanied by a strong bearish candle. This movement signaled a potential exit for long positions and a possible short-entry opportunity. As shown in the example, the Fractals indicator effectively helped traders filter out market noise and make more informed, profitable decisions.
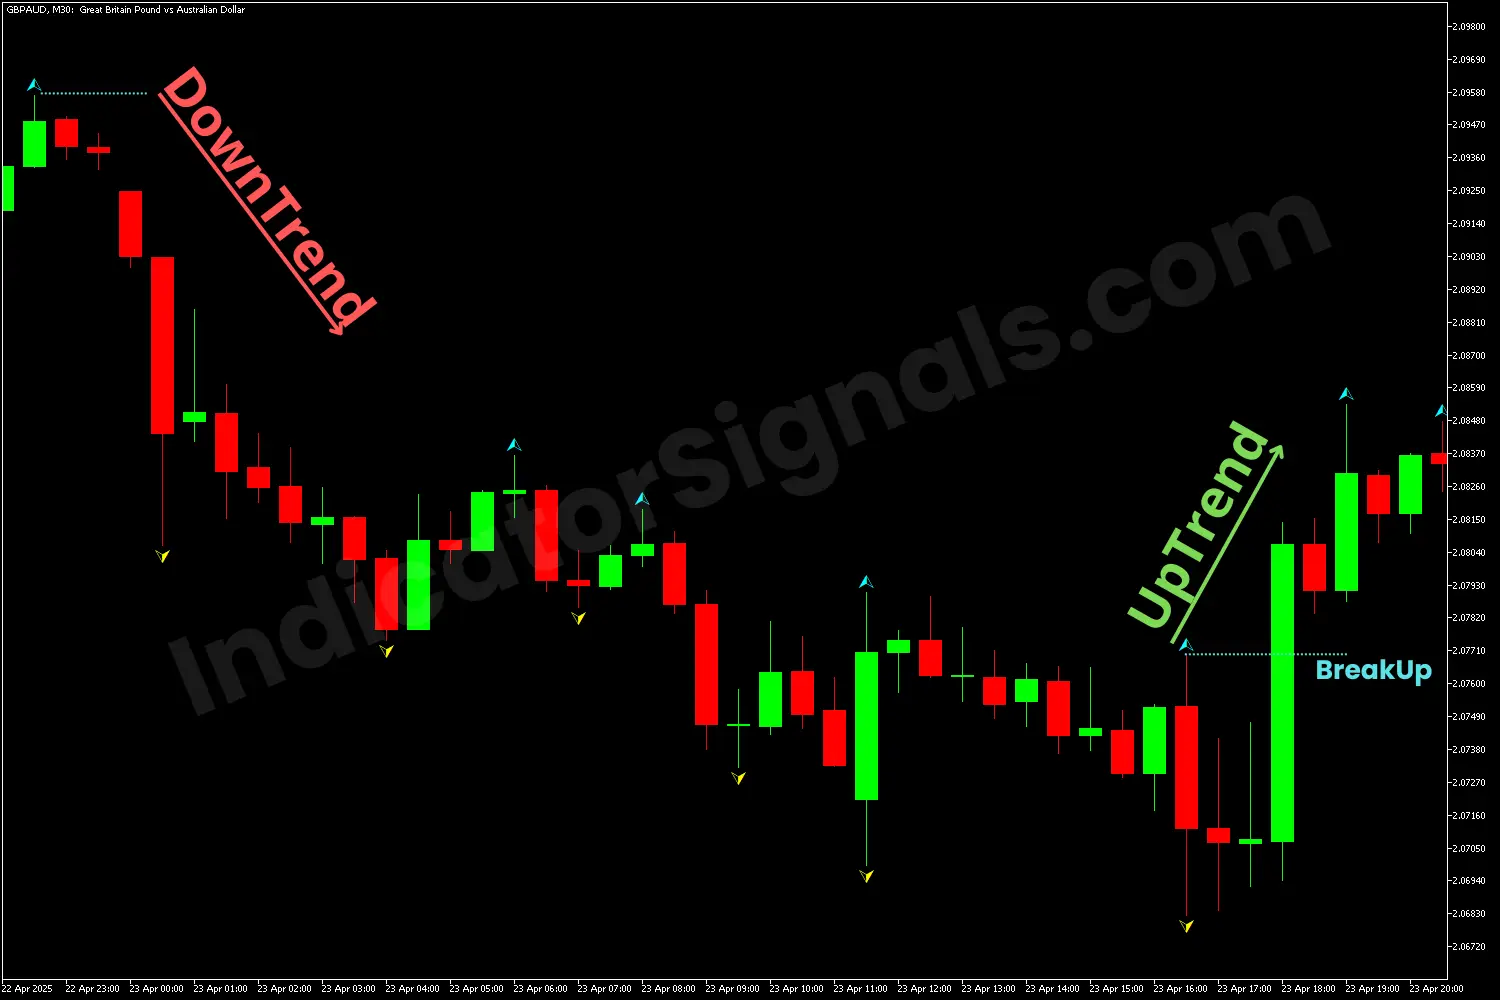
2- In the GBPAUD chart example, using the MT4 version of the Fractals indicator, the indicator confirmed the continuation of the downtrend. This was shown by the price bouncing off from the most recent upward fractal and forming a series of lower bullish and bearish fractals as the trend progressed.
Toward the trend's end, the price rose above the most recent downward (blue) fractal, accompanied by a significant bullish candle. This movement signaled a potential exit for short trades and a potential buying entry. As presented in the example, that is exactly what occurred, and traders could make a profit using these simple strategies provided by the Fractals indicator on both MetaTrader platforms for FREE.
IndicatorSignals.com - Owned & Operated By
FINANSYA LAB
|
2026 © All Rights Reserved.


