Version:
1.0
Updated:
08 April 2025
Downloads:
2
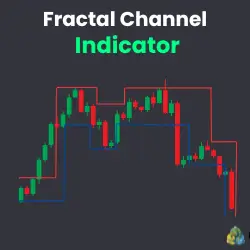
The Fractal Channel (FC) on MetaTrader 4 is a technical analysis indicator that plots dynamic support and resistance levels by connecting recent fractal highs and lows, forming a price channel that adapts to market movements. Also available on the MT5 platform, the FC indicator helps traders identify trend direction and spot breakout opportunities, determining optimal entry and exit points.
The Fractal Channel Indicator is a trend-following channel that uses fractal patterns to draw dynamic channels on the MetaTrader chart. This indicator connects the most recent fractal highs (resistance) and fractal lows (support) to create a price channel, reflecting market structure.
However, traders often used the FC indicator in different trading strategies, adapting it to different market conditions, such as:
- Trend Continuation Strategy:
- Bullish Trend: After a significant upward move, if the price rebounds from the lower channel (support), it signals a long opportunity for the trader, targeting the last high price.
- Bearish Trend: After a significant bearish move, if the price is retesting the upper level (resistance), it signals a short opportunity for the trader, targeting the last low price
- Breakout strategy:
- If the price closes above the upper line, it signals a bullish breakout and a long opportunity.
- If the price drops below the lower level, it indicates a bearish breakout and a selling opportunity.
- Range trading strategy:
- When the price bounces off the upper level of the channel, it indicates a potential selling opportunity.
- When the price rebounds from the lower level of the channel, it signals a long opportunity.
To sum up, the Fractal Channel indicator adapts to both trending and ranging markets. It highlights support and resistance levels, providing traders with high probability entry and exit points, helping them make profitable trade decisions.
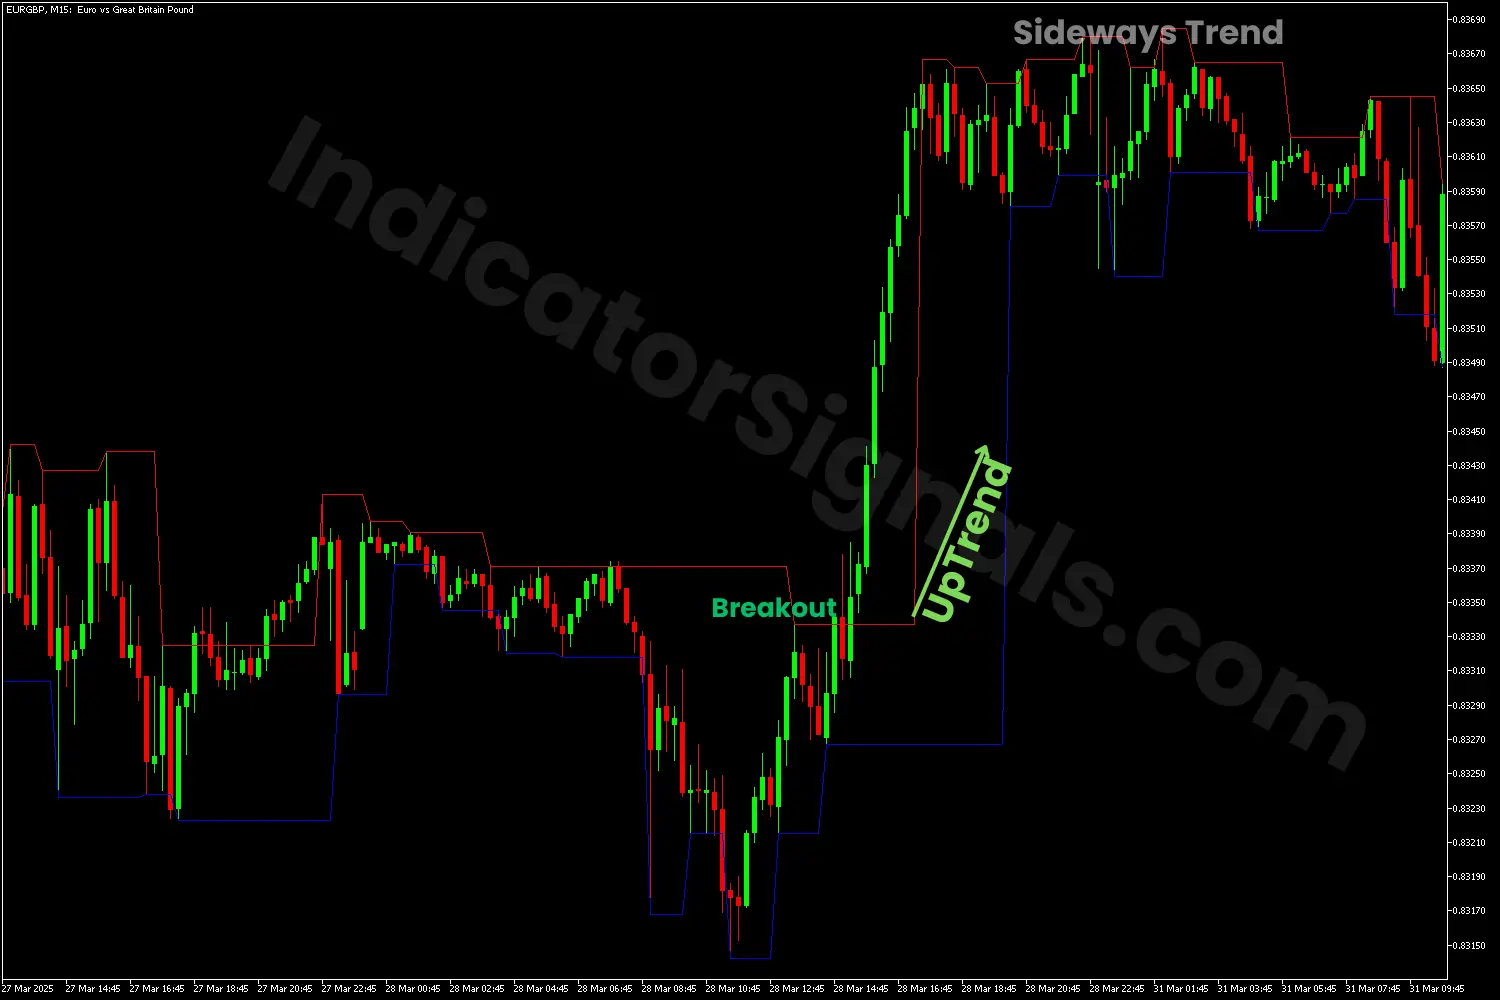
1- In the EURGBP trading example on MetaTrader 5, when the price breaks above the upper level, it signals a buy opportunity for the trader. Toward the upward trend's end, the market enters a sideways trend. In this market condition, traders can profit from it by entering short whenever the price bounces off the red line and, conversely, go long when the price rebounds from the blue line.
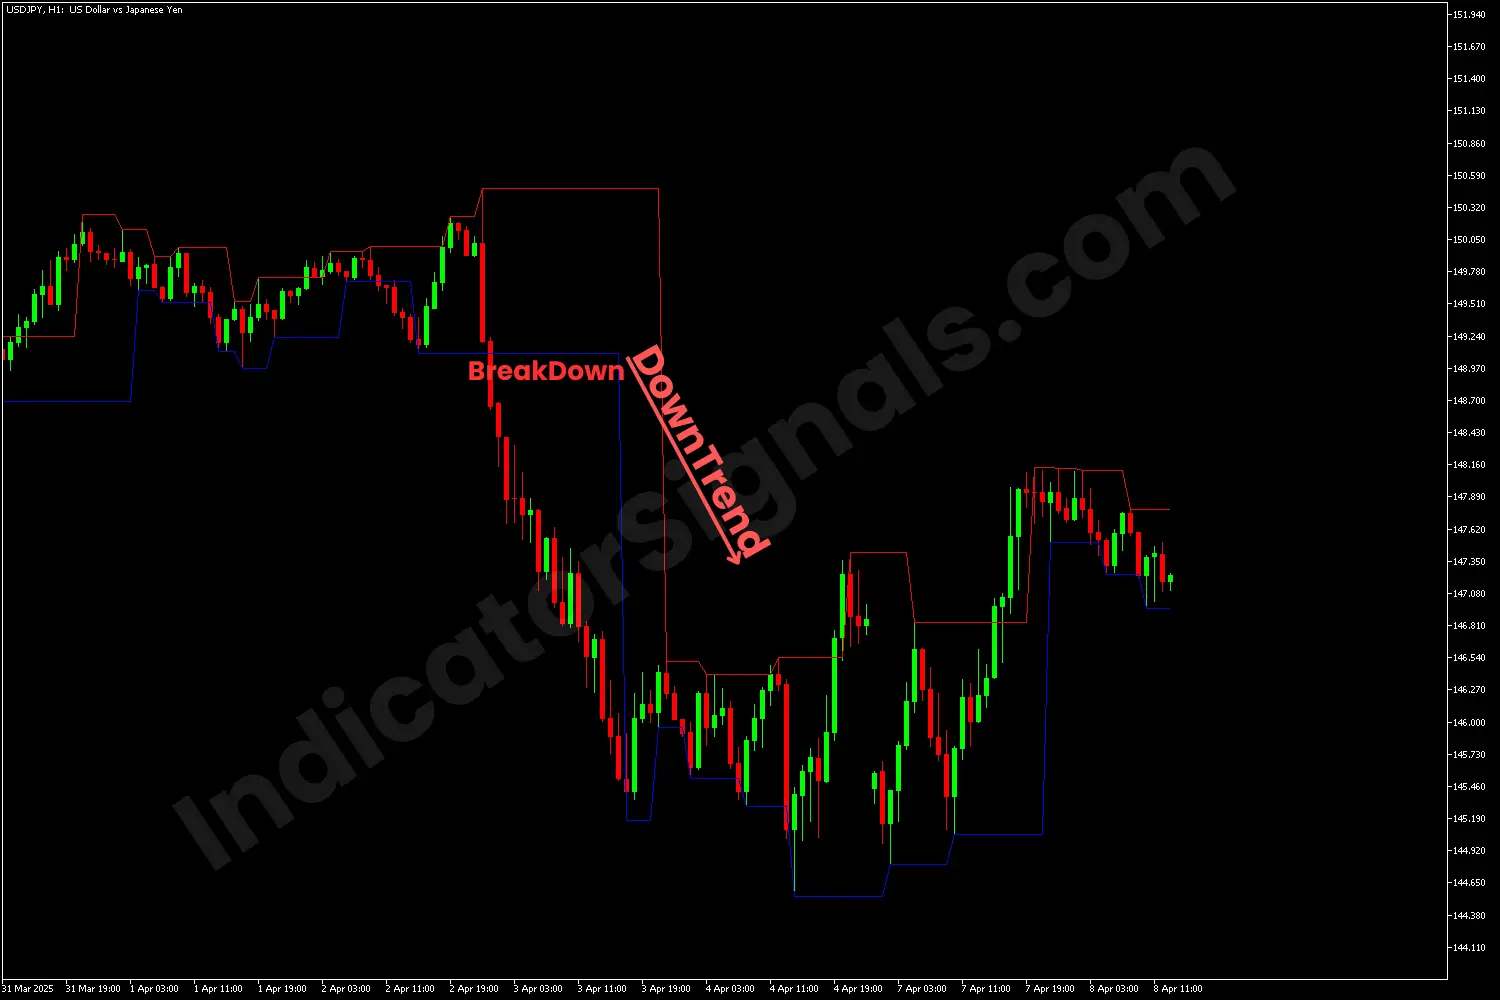
2- In the USDJPY trading example on MetaTrader 4, after a consolidation phase, the price drops, breaking below the last lower line, signaling a potential bearish trend. After two significant red candles, traders could enter short in this situation and exit the trade when the price reenters the channel.
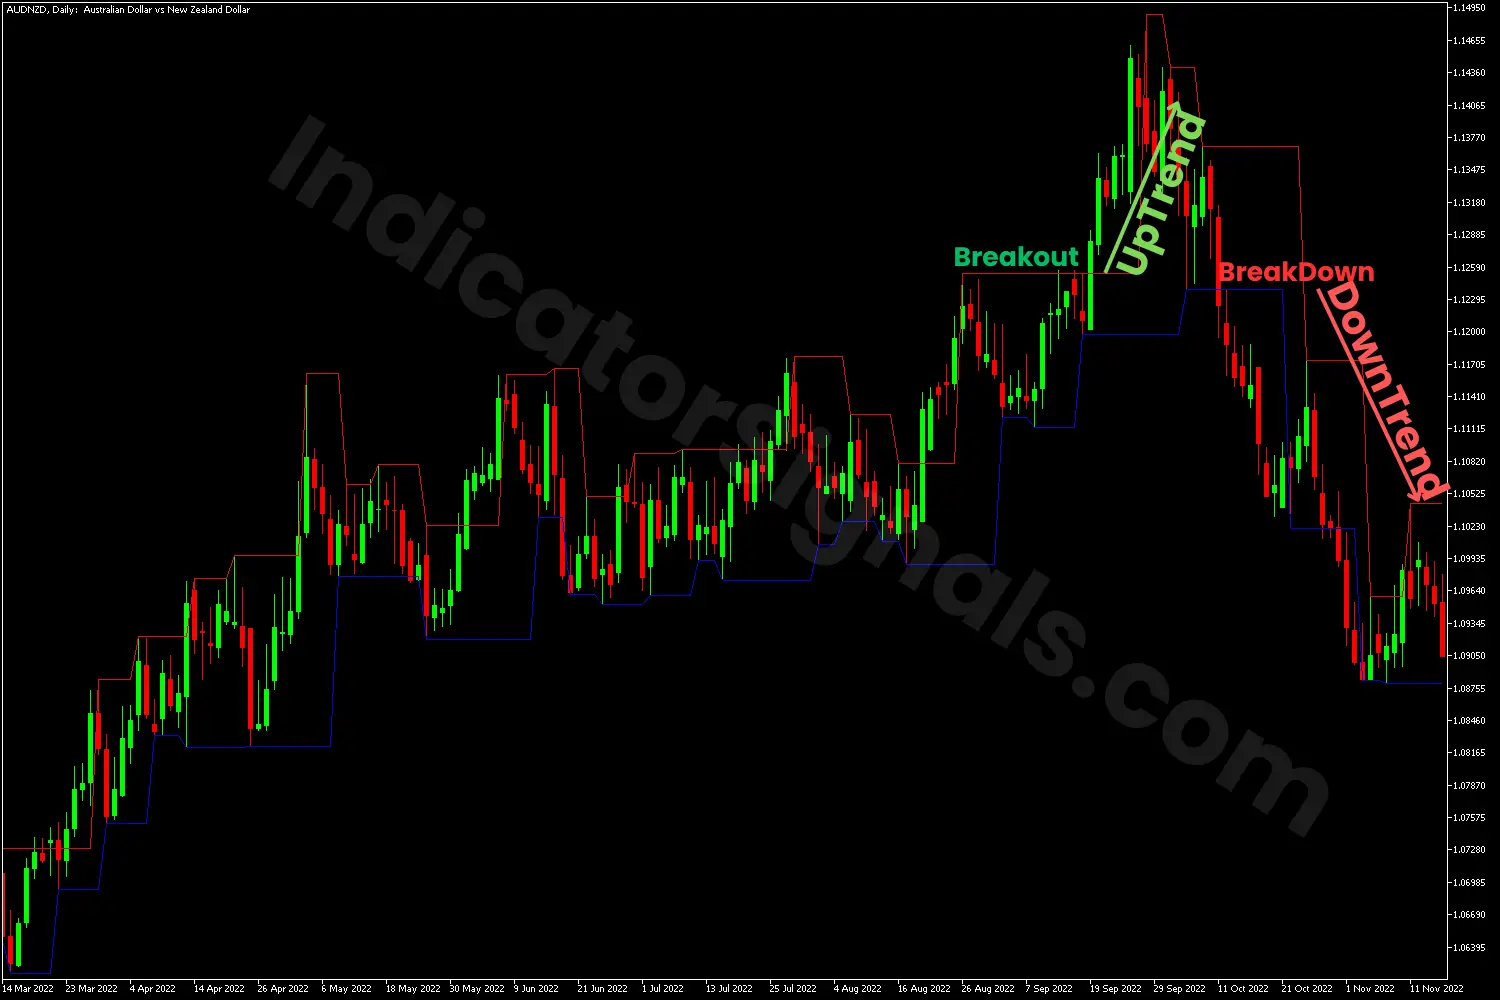
3- In the AUDNZD trading example on MetaTrader 5, during an uptrend, traders could benefit using the Fractal Channel by entering long whenever the price rebounds from the lower line. Moreover, when the price breaks above the resistance line, it confirms and signals a buying opportunity with high volatility. When the price breaks below the support level at the end of the uptrend, it signals a potential bearish reversal, and traders should exit their long positions and enter short in the market.
IndicatorSignals.com - Owned & Operated By
FINANSYA LAB
|
2026 © All Rights Reserved.


