Version:
1.0
Updated:
25 February 2025
Downloads:
3
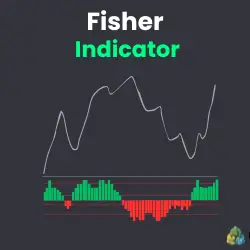
The Fisher Indicator on MT5 is a technical analysis indicator used to identify a trend's direction, strength, and potential reversals by highlighting overbought and oversold market conditions. When this indicator is applied to the MetaTrader 4 chart also, it oscillates around a zero line, with positive values signaling bullish movements and negative ones indicating short opportunities, helping traders make informed trade decisions.
The Fisher Indicator is classified as an oscillator indicator that converts price movements into a normal distribution. This mathematical transformation helps traders detect overbought and oversold conditions more effectively, helping them spot potential reversals through key levels and divergence while clarifying entry and exit points.
Additionally, traders can also use this indicator to determine the appropriate strategy based on the specific market conditions. Here are the three strategies that can be identified using this indicator:
1. Trend following: When the fisher indicator crosses above the 0.5 level, it signals a bullish momentum, while a break below the -0.5 level indicates a potential short opportunity.
2. Market condition: If the indicator reaches the 1.5 level, it may indicate an overbought market condition and a potential reversal, while an oversold condition is identified near the -1.5 level.
3. Divergence: If the price reaches a new high but the Fisher Indicator does not, it signals potential weakness, suggesting a sell opportunity. Conversely, if the price hits a new low while the Fisher shows strength, it may indicate a potential buy opportunity.
To enhance their trading decisions, traders should integrate these strategies with other indicators that follow similar approaches to determine optimal entry and exit points.
To help traders understand how to use this indicator and, most importantly, its specific strategies, I will explain everything through two different trading examples.
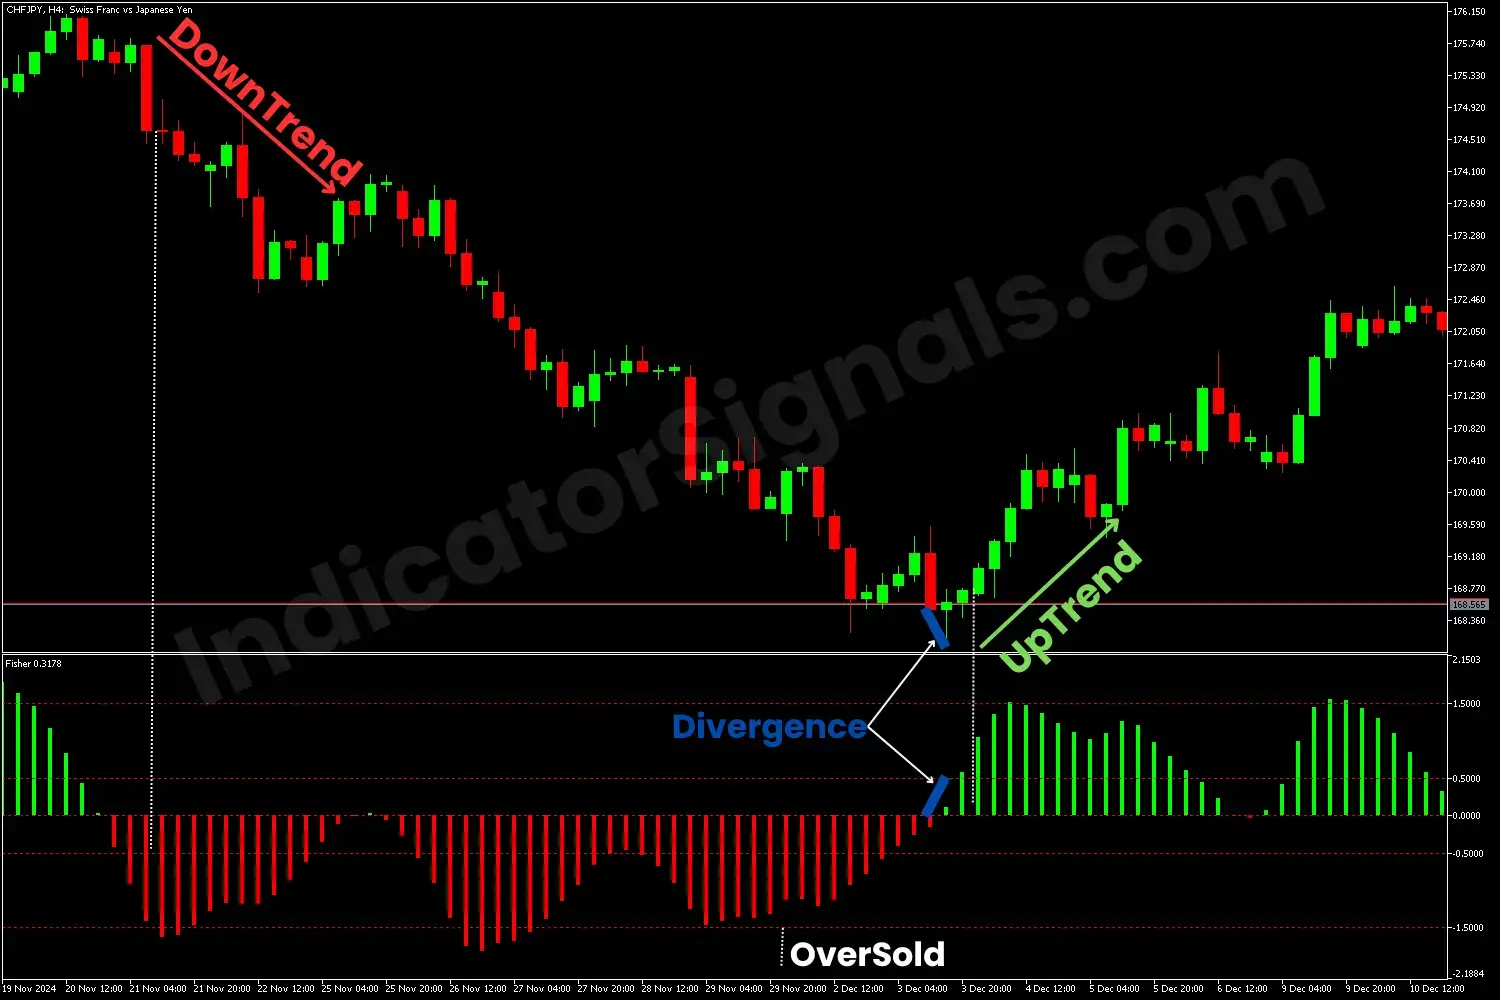
In the CHFJPY chart example on MT4, the Fisher indicator drops below the -0.5 level, signaling the beginning of a downtrend. As the trend nears its end, the indicator enters the oversold zone and rebounds multiple times. Eventually, a divergence emerges between the price and the indicator, suggesting a potential reversal. This is confirmed as the indicator crosses above the 0 level and, subsequently, the 0.5 level, signaling a buying opportunity.
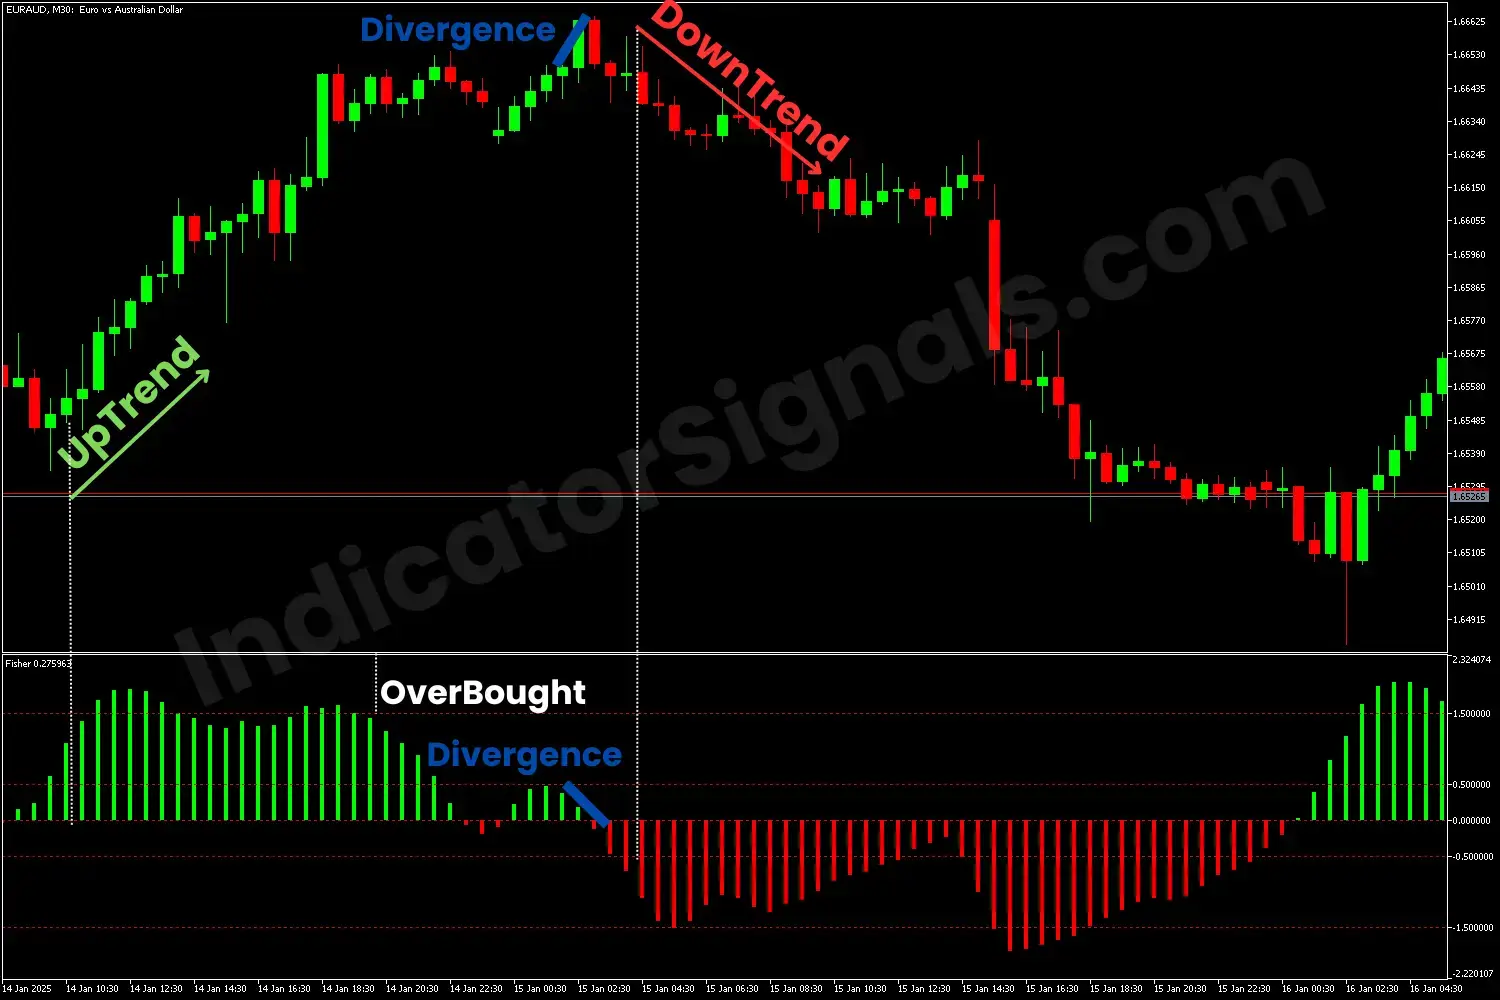
In the EURAUD chart example on MT5, the Fisher indicator rises above the 0.5 level, signaling the start of an upward trend. As the trend moves toward the overbought zone, the indicator bounces from it twice, with a divergence between it and the price, suggesting a potential reversal. This is confirmed as the indicator breaks below zero and, importantly, the -0.5 level, signaling a short opportunity.
By combining the three strategies at the same time with two or more indicators, such as RSI or MA, traders can make accurate trade decisions.
IndicatorSignals.com - Owned & Operated By
FINANSYA LAB
|
2026 © All Rights Reserved.


