Version:
1.0
Updated:
02 June 2025
Downloads:
6
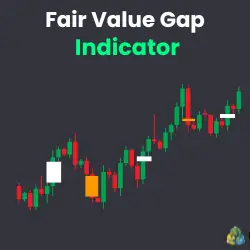
The Fair Value Gap (FVG) Indicator for MetaTrader 5 highlights imbalances in price action and displays gaps where institutional orders may have been left unfilled. As shown on the MT4 chart as well, often formed by significant price movements, act as potential areas of support or resistance, making them useful for traders seeking entry and exit points, whether during bearish or bullish trends.
The FVG falls under the levels category of technical analysis indicators available on MetaTrader platforms. It is specifically designed to detect inefficiencies or imbalances in price movement, areas where institutional activity may have caused the market to skip over certain price levels, leaving gaps that are often revisited later. These gaps typically appear as a three-candle formation, where the body of the middle candle exceeds the high and low wicks of the surrounding candles, highlighting an imbalance in order execution.
The indicator highlights two main types of gaps:
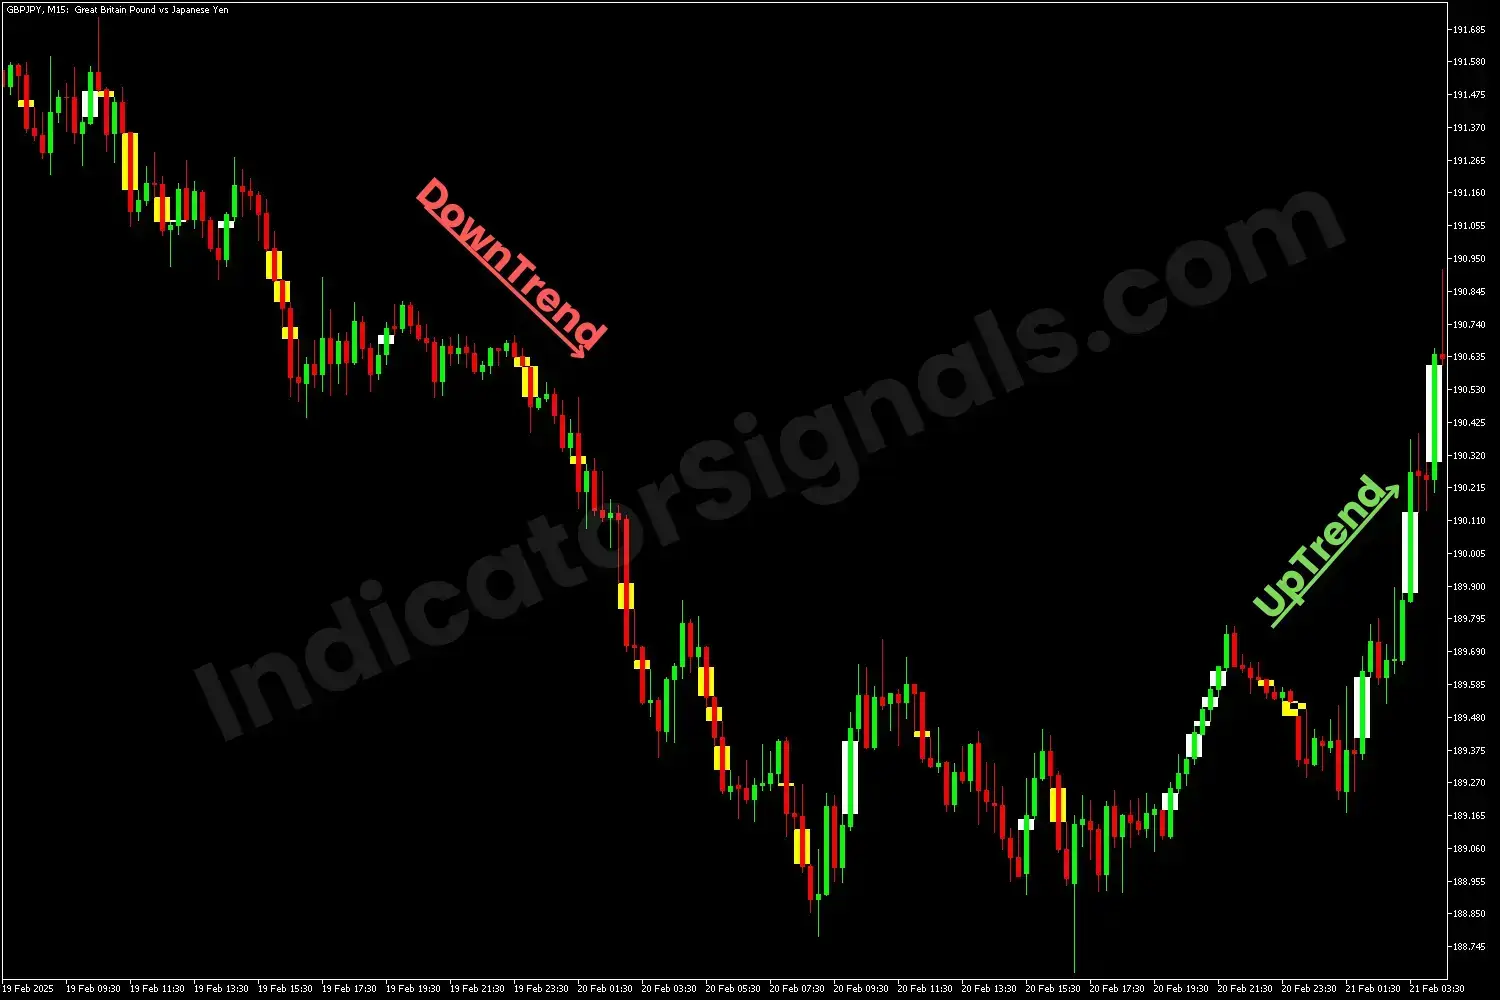
- White gap: Formed when the price moves sharply upward, indicating buyer dominance. It suggests that aggressive buying may have left unfilled orders below the move, forming a potential support zone.
- Yellow gap: Occurs when the price drops significantly, indicating seller dominance. This gap often represents an area of potential resistance as sell orders may remain unfilled above the move.
Traders utilize these Fair Value Gaps to anticipate price retracements, as institutional traders often return to these levels to fill unexecuted buy or sell orders, making them key zones of interest.
- Trend Continuation:
- When the price enters an FVG zone but fails to fill it, and then resumes the trend, this often signals that the imbalance remains valid. Traders can enter trades in the direction of the prevailing trend, using the gap as a confirmation zone.
- Potential Reversals:
- If the price breaks above a recent bearish (yellow) FVG and then forms a bullish (white) one, it may indicate a bullish reversal, signaling a potential long opportunity.
- Conversely, if the price breaks below a recent bullish (white) FVG and then creates a bearish (yellow) one, it suggests a bearish reversal, opening the door for a short position.
- Risk Management and Stop-Loss Placement:
Beyond entries and exits, the FVG indicator defines stop-loss levels. Traders often place:
- Stop-losses above a bearish FVG when entering a short position,
- Or below a bullish FVG when entering a long trade.
This use aligns well with institutional behavior, allowing for tighter stop placements based on logical price structures.
1- In the first trading example, as shown on the MetaTrader 4 chart, the price begins to drop, forming a series of bearish candles where the body of the middle candle extends beyond the wicks of the surrounding candles. This pattern highlights the formation of a bearish Fair Value Gap (FVG), a clear indication of seller dominance and a short opportunity for traders looking to capitalize on the bearish momentum.
As the trend matures, a bullish FVG (white gap) eventually appears, suggesting a potential shift in momentum and a bullish reversal. However, this early signal is followed by a retracement, where the price declines once more, leading to a phase of indecision or consolidation.
The turning point comes when the price revisits the earlier white gap, a level often targeted by institutional activity, combined with the appearance of three consecutive bullish FVGs. This cluster of bullish gaps reflects increased buying pressure, marking the start of a new uptrend and providing traders with a strong long-entry opportunity.
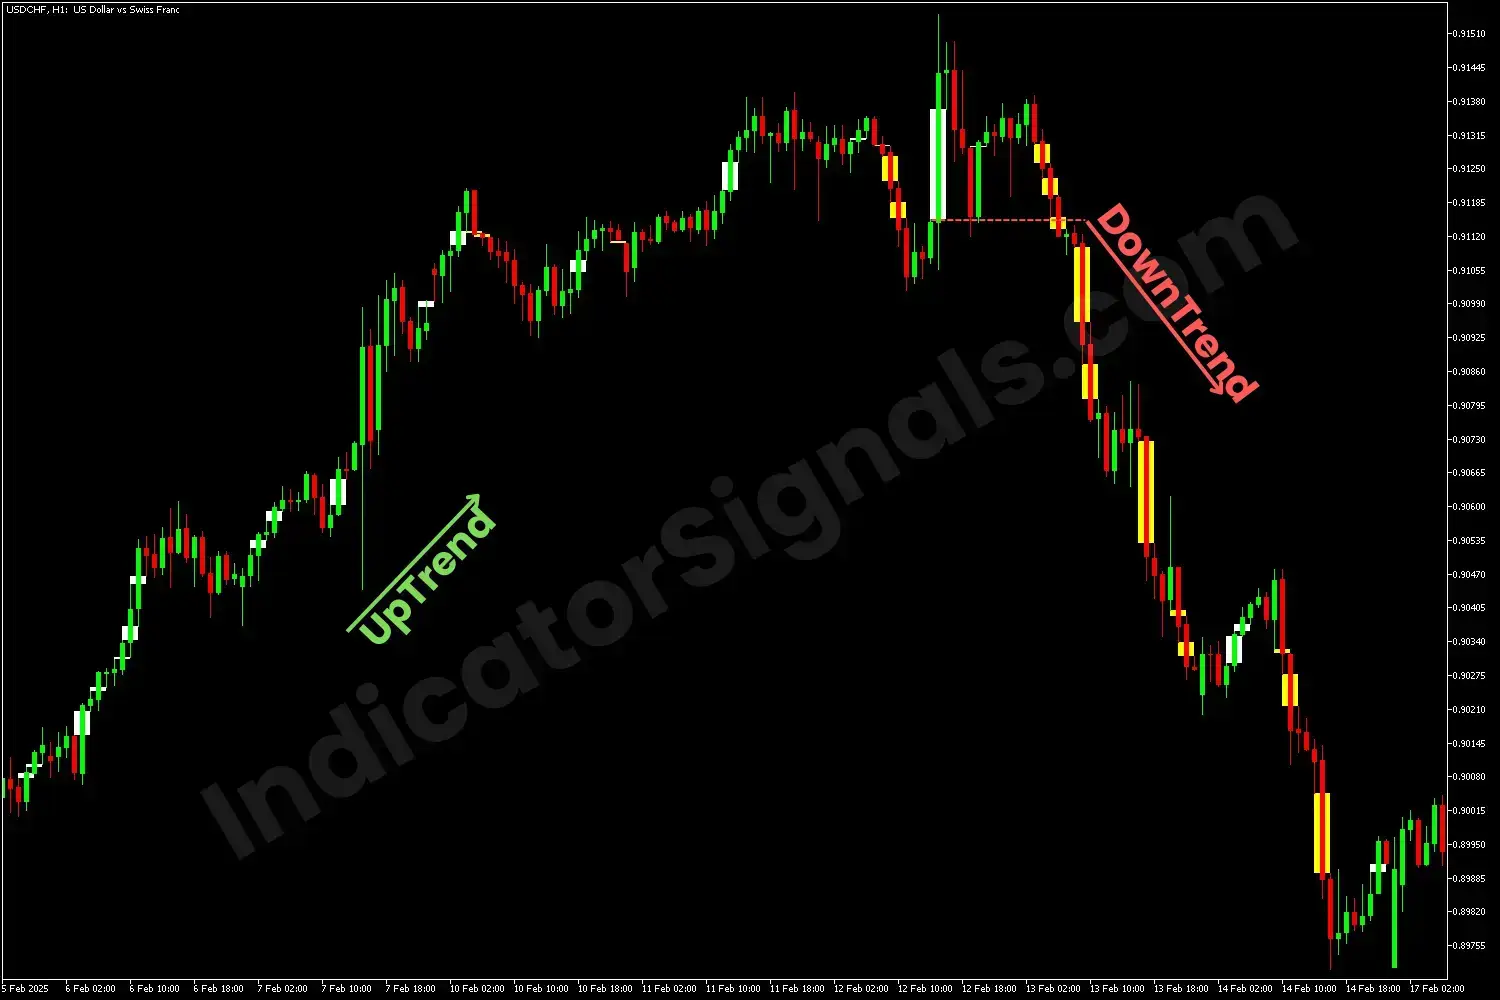
2- In the second trading example, presented on the MetaTrader 5 chart, the market exhibits a strong upward movement, forming bullish candles where the middle candle extends above the highs of the surrounding candles, thereby creating a bullish FVG. This pattern signifies buyer strength and presents a long opportunity as the price continues to push higher.
As the trend begins to weaken, the price breaks below the most recent and significant bullish FVG zone, signaling a loss of bullish control. This breakdown serves as an early warning for a potential trend reversal. When confirmed by price action, it presents a clear short opportunity for traders anticipating the start of a bearish phase.
IndicatorSignals.com - Owned & Operated By
FINANSYA LAB
|
2026 © All Rights Reserved.


