Version:
1.0
Updated:
11 April 2025
Downloads:
0
The Envelopes Indicator on MetaTrader 4 is a technical analysis indicator that displays two Moving Average Bands. These bands represent a fixed percentage distance, acting as dynamic support and resistance levels. It can also be used on the MT5 platform, helping traders identify market direction and potential trend reversals.
The Envelopes is a trend-following indicator that displays two bands, plotted at equal distance above and below the price's moving average. These distances are defined by a fixed percentage deviation from the moving average, creating an upper and lower envelope.
- The upper band is calculated by adding a percentage to the moving average.
- The lower band is calculated by subtracting the same percentage.
Furthermore, traders often used this indicator for two principal trading strategies:
- Market direction:
- Upward Trend: When the price breaks above the upper band and remains near it, signaling a potential long opportunity
- Downward trend: When the price falls under the lower band and stays near it, signaling a potential short
- Sideways Trend: When the price moves between the two bands, it signals a short-selling opportunity when the price bounces off the upper band and a short-buying opportunity when the price rebounds from the lower band.
- Trend reversal:
- Bullish reversal: During a downtrend, if the price rises above the previous resistance level (upper band), traders should exit their selling trades and consider entering long.
- Bearish reversal: During an uptrend, if the price drops below the previous support level (lower band), traders should exit their buying trades and consider entering short.
To avoid false signals, it is recommended to combine this indicator with other categories of technical analysis indicators, such as oscillator or volume, which are available for FREE on our platform.
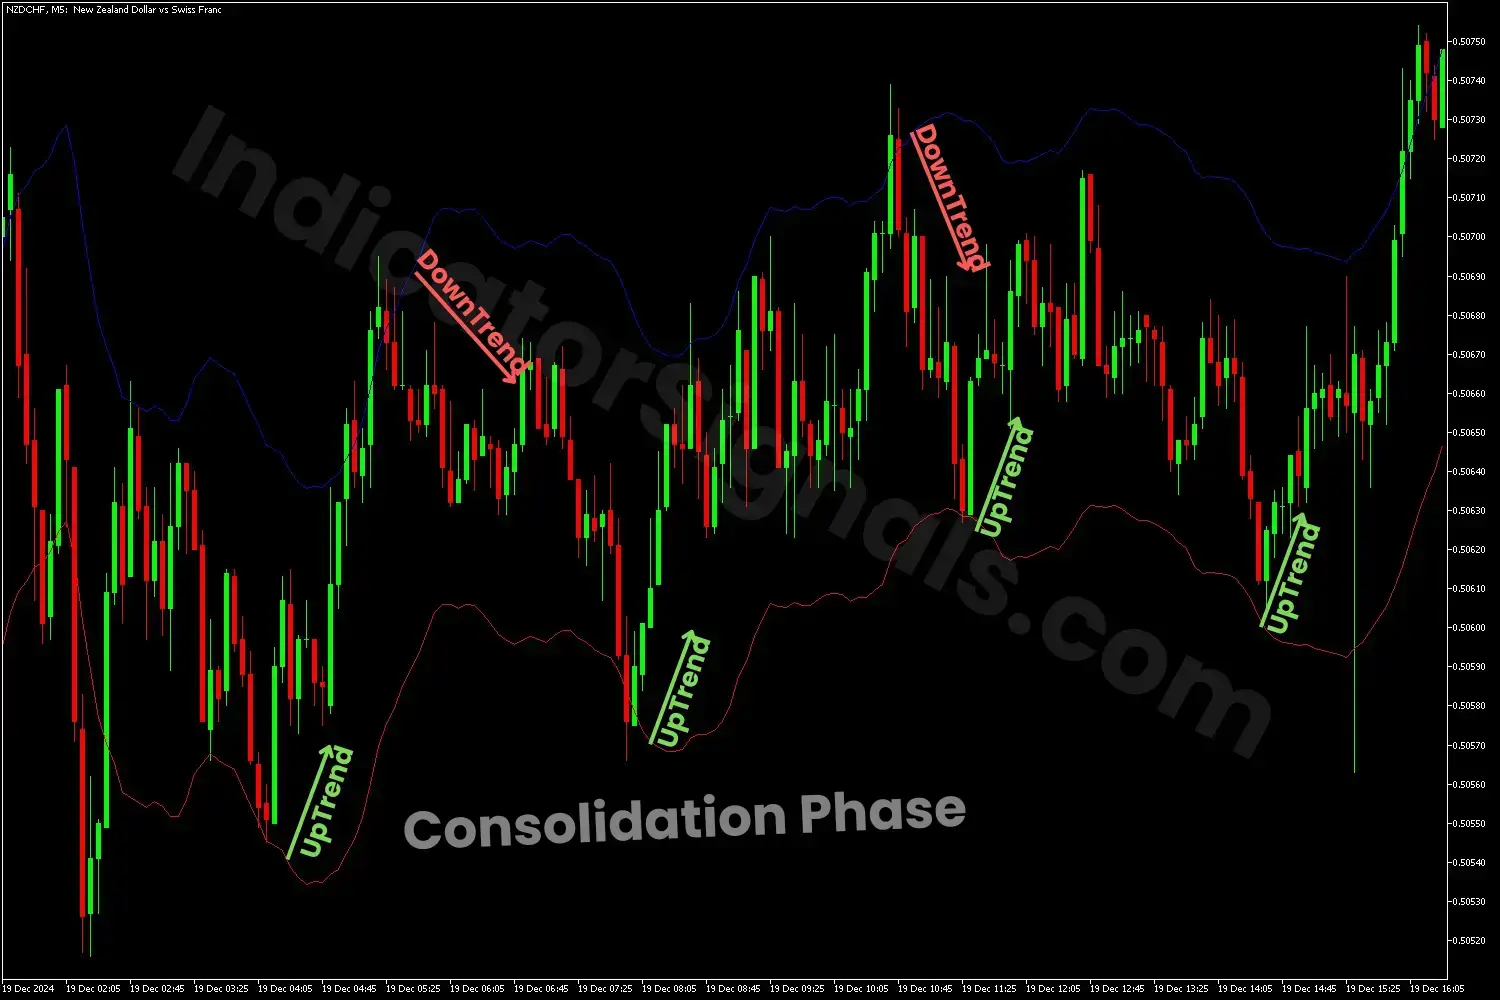
1/ In the NZDCHF trading example using the Envelopes indicator on MetaTrader 5, during a sideways market, when the price rebounds from the lower band, it signals a short-buying opportunity, targeting the upper band and making the stop-loss price below the red line.
Conversely, when the price bounces off the upper band, it signals a short-selling opportunity, targeting the lower band and making the stop-loss price just above the blue line.
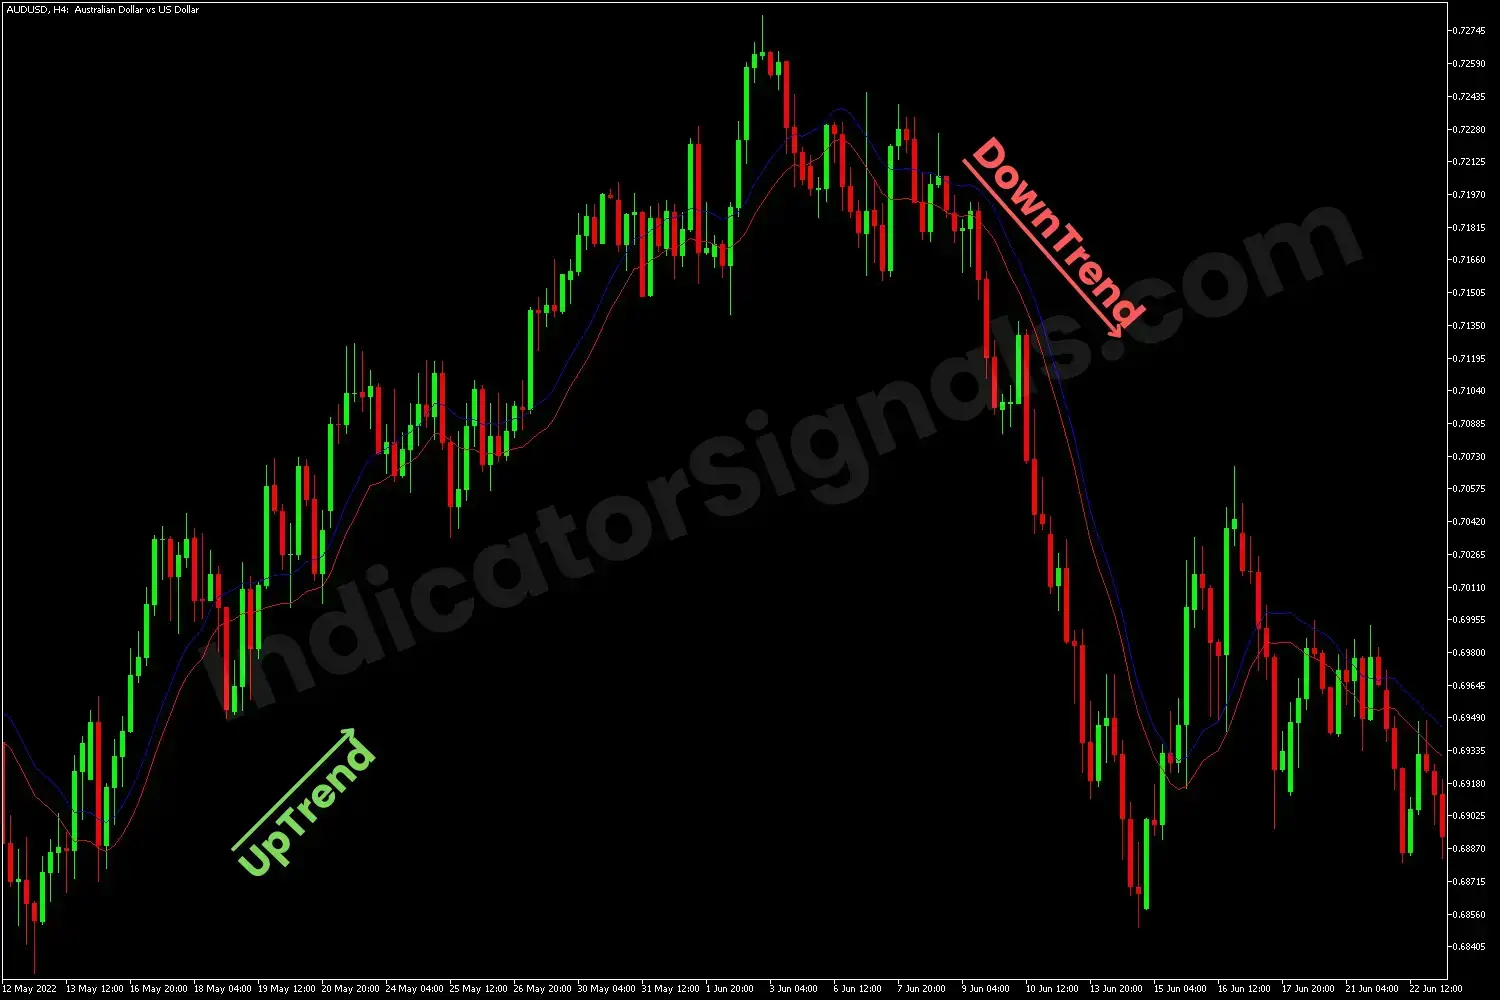
2/ In the AUDUSD trading example using the Envelopes indicator on MetaTrader 4, the indicator confirms the bullish sentiment in the market as the price breaks above the upper line and remains near it. Whenever there is a trend correction, the price doesn't break below the previous support line, confirming the trend continuation.
Toward the trend's end, the price falls, breaking below the lower band and the previous support level, confirming the bearish reversal. Traders should exit their long positions and enter short.
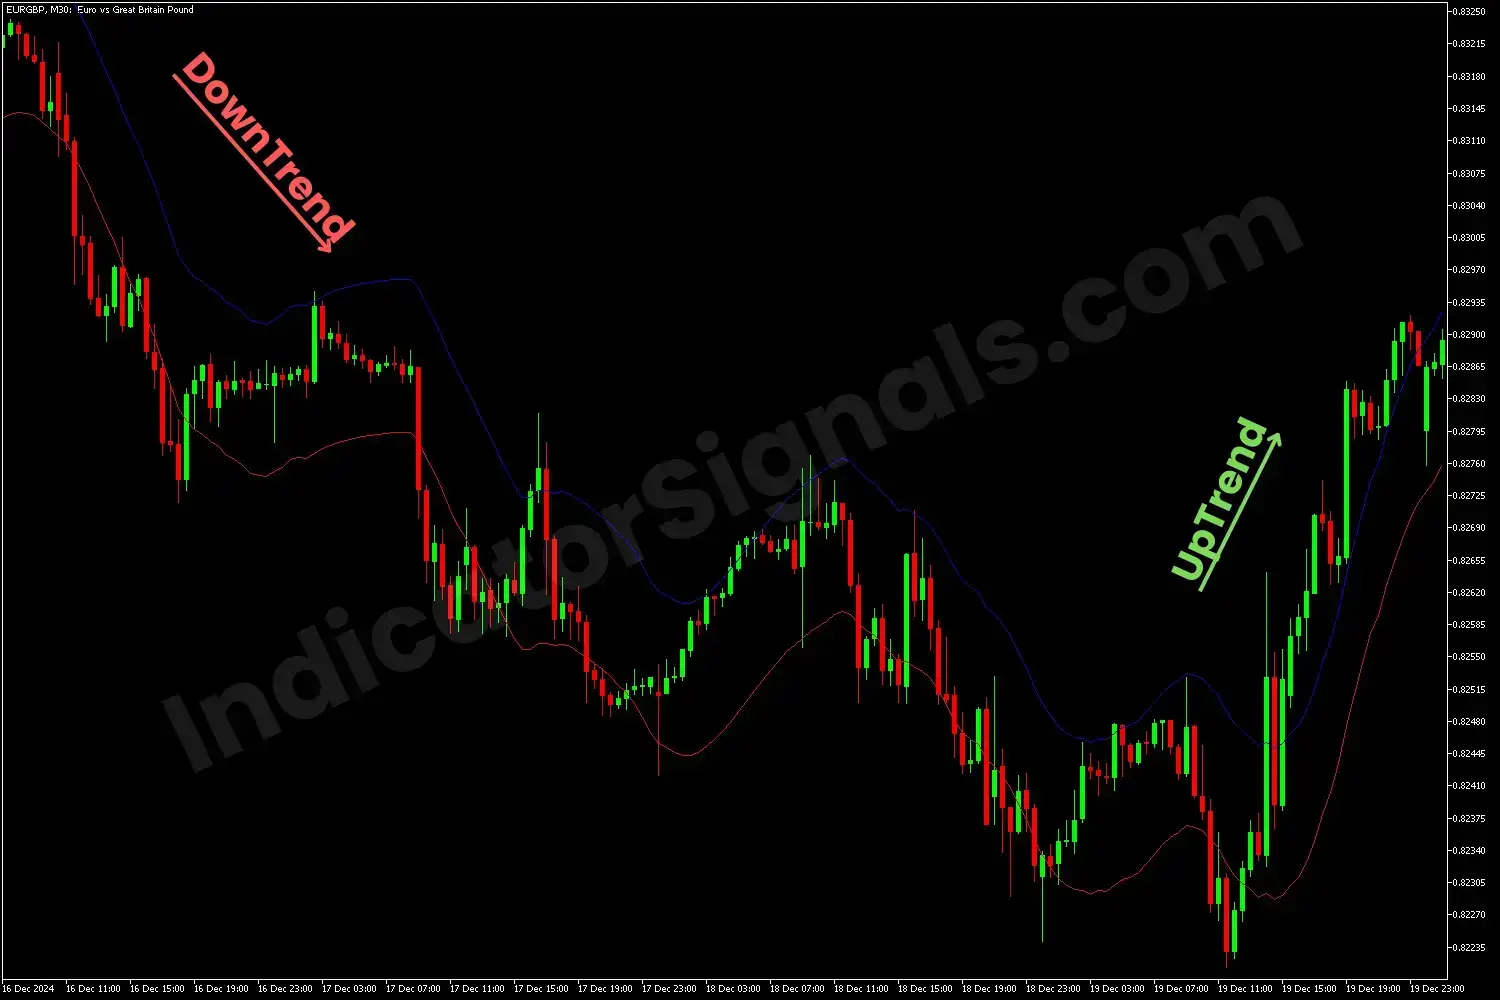
3/ In the EURGBP trading example using the Envelopes indicator on MetaTrader 5, the indicator confirms the bearish sentiment in the market as the price breaks below the lower line and moves near it. Whenever there is a trend correction, the price doesn't break above the previous resistance line, confirming the trend continuation.
Toward the trend's end, the price rises, breaking above the upper band and the previous resistance level, confirming the bullish reversal. Traders should exit their short positions and enter long.
IndicatorSignals.com - Owned & Operated By
FINANSYA LAB
|
2026 © All Rights Reserved.
.png)


