Version:
1.0
Updated:
19 May 2025
Downloads:
3
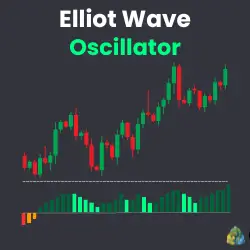
The Elliott Wave Oscillator (EWO) Indicator for MetaTrader 5 is a momentum-based histogram tool that calculates the difference between a fast and a slow-moving average based on price action. Also available on the MT4 platform, the EWO helps traders visually detect bullish and bearish momentum shifts, wave cycles, and potential trend continuations or reversals, enabling them to identify optimal entry and exit points.
The EWO indicator is developed, based on Elliot wave formations, to measure market momentum and identify trend direction. The indicator calculates the difference between two moving averages, a Fast MA and a Slow MA, based on a user-defined method and price type, and displays the result as a color-coded histogram in a separate sub-window.
By default, the fast MA period is 5 and the slow MA period is 35, which can be adjusted according to the trader’s strategy. The difference between these two moving averages (Fast MA - Slow MA) forms the core oscillator line, the EWO value. This value is plotted as a histogram with four main distinct colors to show momentum strength and direction:
- Bright Green: Bullish momentum increasing (EWO > 0 and rising).
- Light Green: Bullish momentum decreasing (EWO > 0 but falling).
- Firebrick Red: Bearish momentum increasing (EWO < 0 and falling).
- Orange: Bearish momentum decreasing (EWO < 0 but rising).
This intuitive visual representation helps traders quickly interpret market conditions.
However, traders commonly use this indicator in the following ways:
- Wave Counting (Elliott Wave Theory): Helps identify impulsive and corrective wave structures.
- Momentum Confirmation: Detects divergence between price and momentum for possible reversal signals.
- Trend Strength Analysis: Evaluate whether the market is strengthening or weakening in its current direction.
- Entry & Exit Signals: Histogram color shifts may provide early alerts for entering or exiting trades.
Furthermore, for those who prefer straightforward trading strategies, traders can rely on these basic signals:
* Buy Entry: When the histogram changes from red to green, suggesting a potential bullish reversal or the continuation of an uptrend.
* Sell Entry: When the histogram shifts from green to red, indicating a possible bearish momentum shift.
While the EWO offers valuable insight into market dynamics, traders should combine it with other indicators such as price action analysis, support and resistance levels, or additional momentum indicators such as RSI or MACD to confirm signals and filter out noise.
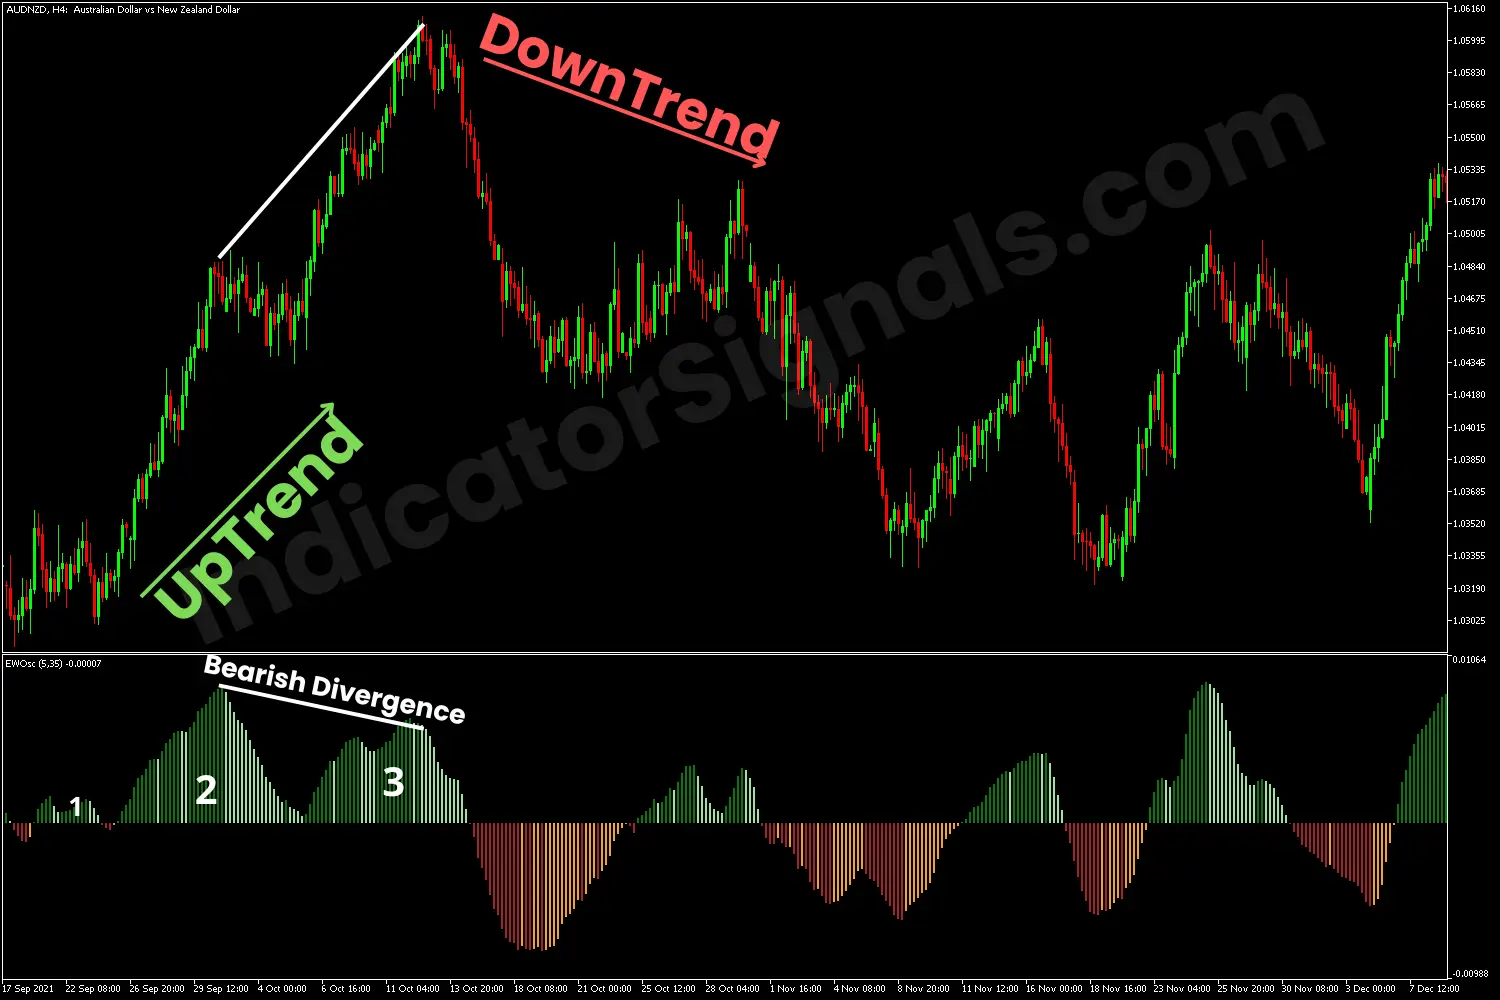
1- In the AUDNZD H4 chart example on MT4, the EWO indicator confirmed an uptrend by displaying green histogram bars and highlighting the three Elliot waves, with the second wave showing the strongest momentum. This was followed by a bearish reversal, indicated by the histogram forming lower highs while the price made higher highs, a classic bearish divergence.
Once the bars turned red, it signaled the start of a downtrend and a good short entry. As seen in the indicator window, the bearish trend continued with a strong initial drop, followed by a brief correction and further decline, presenting a clear selling opportunity for traders.
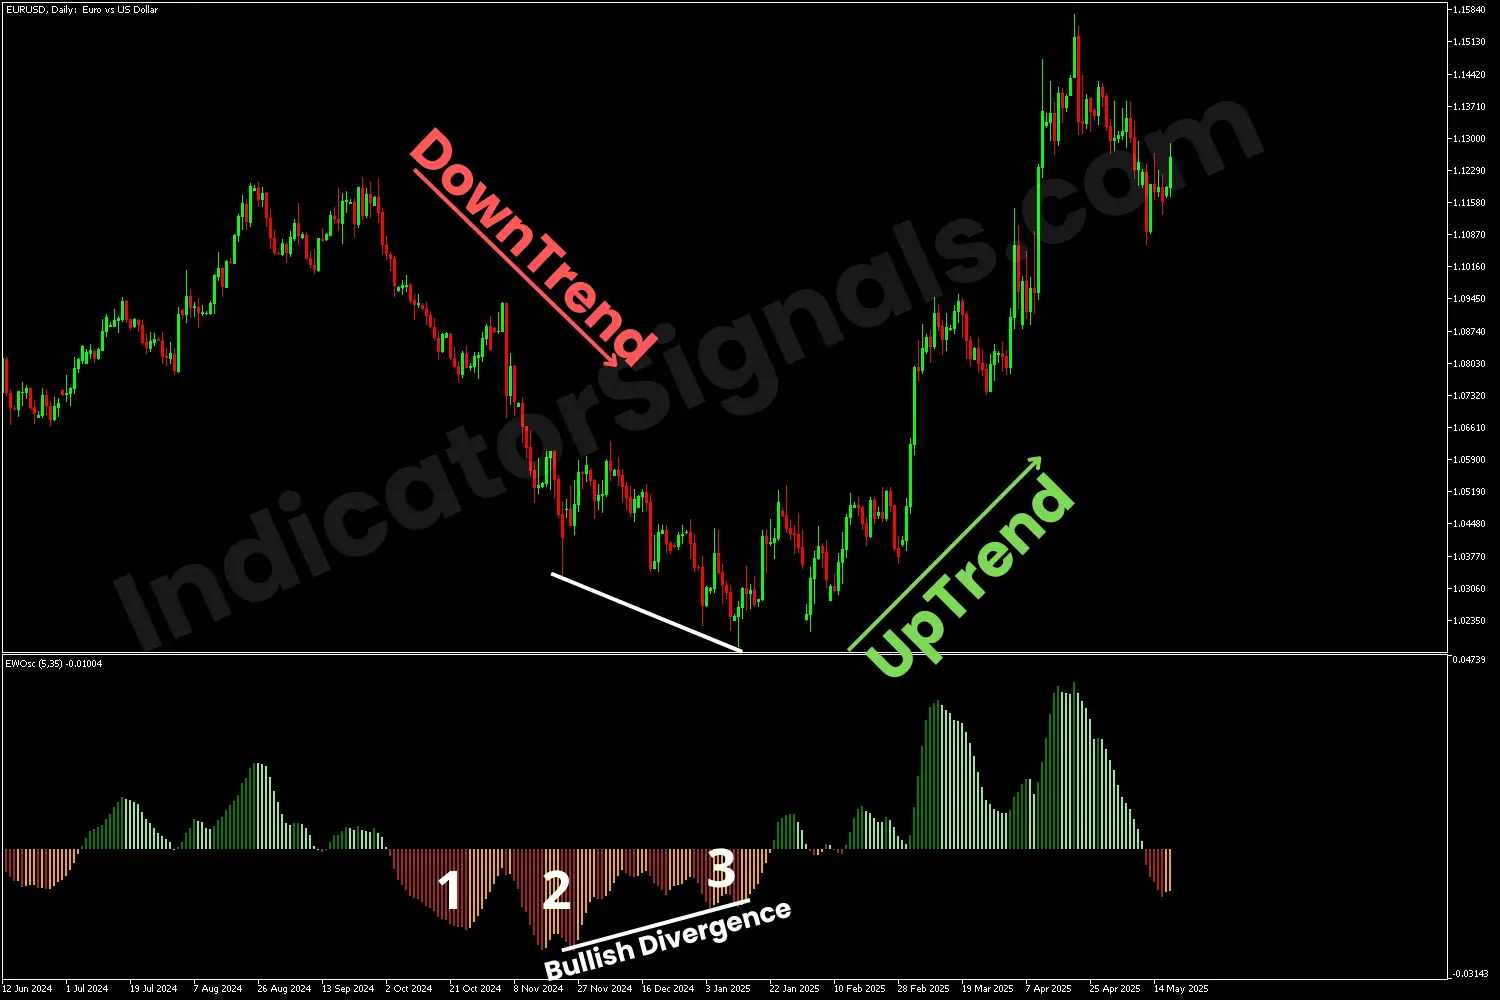
2- In the EURUSD Daily chart example on MT5, the EWO indicator confirmed a downtrend by displaying red histogram bars and highlighting the three Elliot waves, with the second wave showing the strongest momentum. This was followed by a bullish reversal, indicated by the histogram forming higher lows while the price made lower lows, a classic bullish divergence.
Once the bars turned bullish, it signaled the start of an uptrend and a good long entry. As shown in the indicator window, the bullish trend continued with a strong initial rise, followed by a brief correction and further increase, presenting a clear buying opportunity for traders.
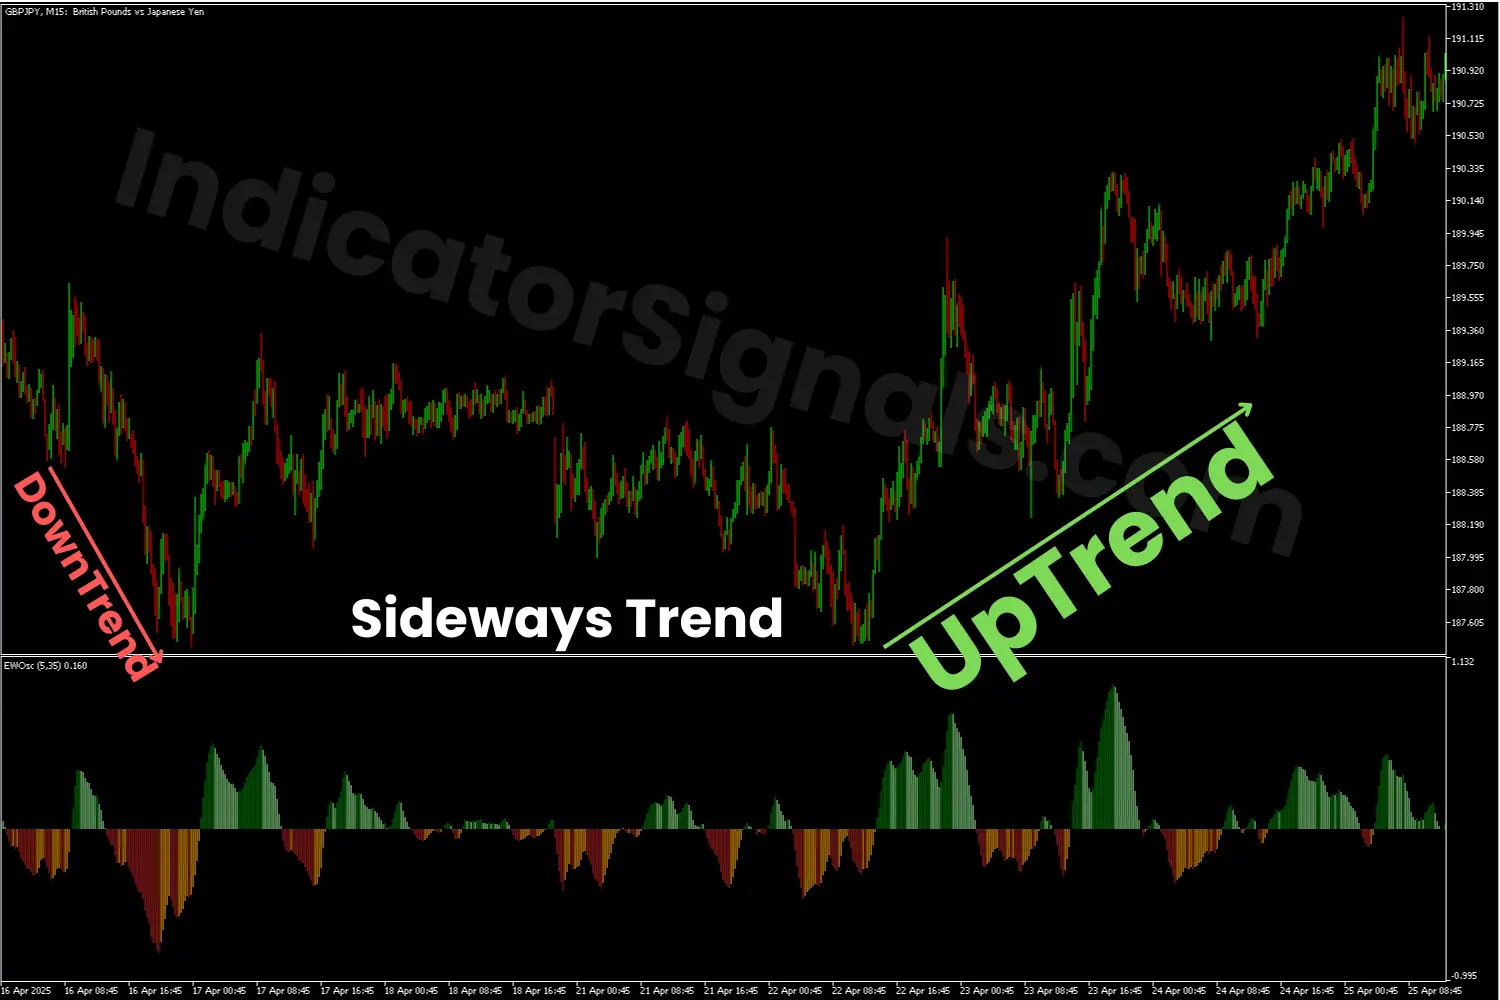
3- In the GBPJPY M15 chart example, using the MT5 version of the EWO indicator, a sell signal was generated when the histogram turned red, indicating strong bearish momentum. This continued until orange bars appeared, suggesting that bearish momentum was weakening. As the histogram showed small bearish and bullish bars, it signaled a sideways market with low momentum.
Later, when bullish bars emerged, confirming renewed bullish momentum as the price broke to the upside. This indicated a bullish breakout and a potential buying opportunity. Traders could wait for a minor pullback before entering a long position to align with the new upward trend.
IndicatorSignals.com - Owned & Operated By
FINANSYA LAB
|
2026 © All Rights Reserved.


