Version:
1.0
Updated:
25 February 2025
Downloads:
2
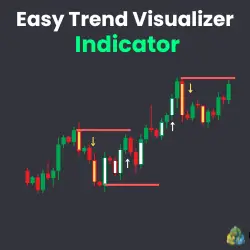
The Easy Trend Visualizer Indicator on MT4 is a technical analysis indicator that simplifies trend detection by displaying trend strength, direction, and support and resistance levels. This indicator, on MetaTrader 5, will also help traders identify bullish, bearish, or even sideways market movements to make informed trade decisions and set entry and exit points for long or short positions.
The Easy Trend Visualizer Indicator is classified as a trend-following indicator designed to filter out market noises and identify trend direction. By applying this indicator, traders will visualize color-coded signals that simplify market analysis. The white-colored candles, accompanied by white arrows, indicate bullish movements, while the yellow ones represent bearish trends. Furthermore, the horizontal lines, based on the standard Metatrader ADX (Average Direction Movement Index), act as dynamic support and resistance levels, showing where the trend begins and ends and any potential breakouts.
This indicator can be utilized by traders in multiple trading strategies, including:
- Identifying Trend:
- When white-colored candles appear alongside white arrows, it suggests an uptrend, signaling a long opportunity.
- When yellow-colored candles appear alongside yellow arrows, it suggests a bearish direction, signaling a selling opportunity.
- Trading breakouts:
- Bullish breakout: If the price breaks above a resistance level, it suggests a bullish continuation.
- Bearish breakout: if the price breaks below a support level, it signals a bearish continuation.
- Potential Reversal:
- Bullish reversal: When the price approaches a support level during a downtrend, and white-colored candles begin to appear, it indicates a possible shift to an uptrend. Traders should consider closing their short positions and preparing to enter a long trade.
- Bearish reversal: When the price reaches a resistance level during an uptrend, d and yellow-colored candles emerge, it suggests a potential trend reversal to the downside. In this case, traders should consider exiting their long positions and looking for shorting opportunities.
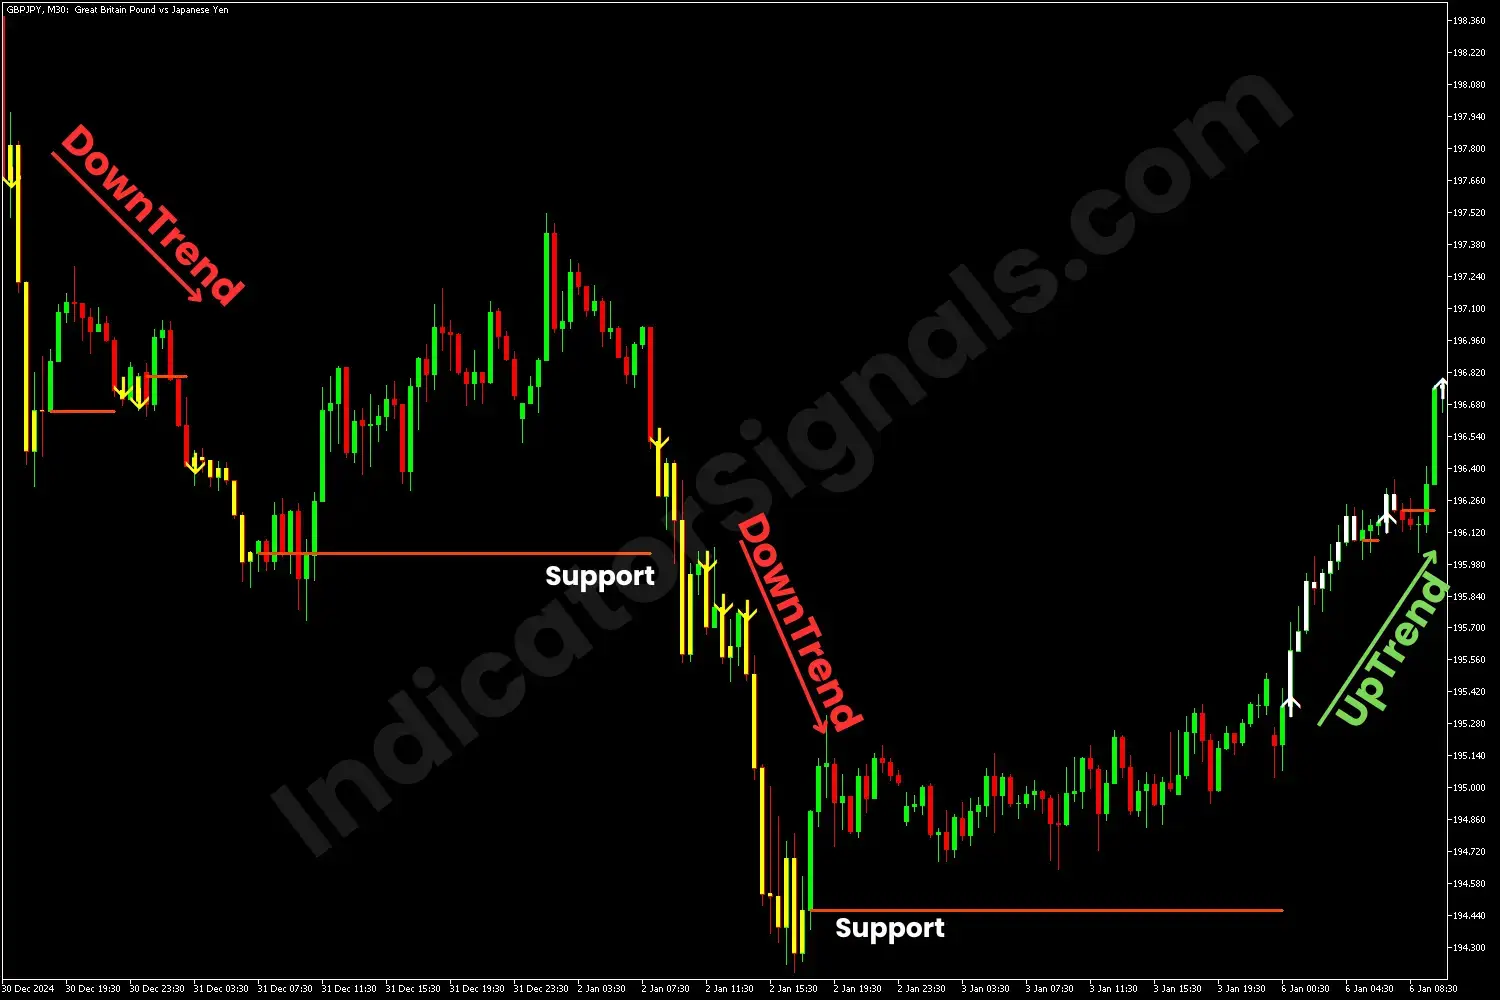
In the GBPJPY chart example on MT4, the downtrend is confirmed by the appearance of yellow-colored candles and arrows, suggesting a continuation of bearish movement. As the price breaks below the support level, it reinforces the downward trend until the next support line is reached. At this point, the emergence of white-colored candles and arrows signals the reversal to an uptrend, and the trader should exit his short position and go long.
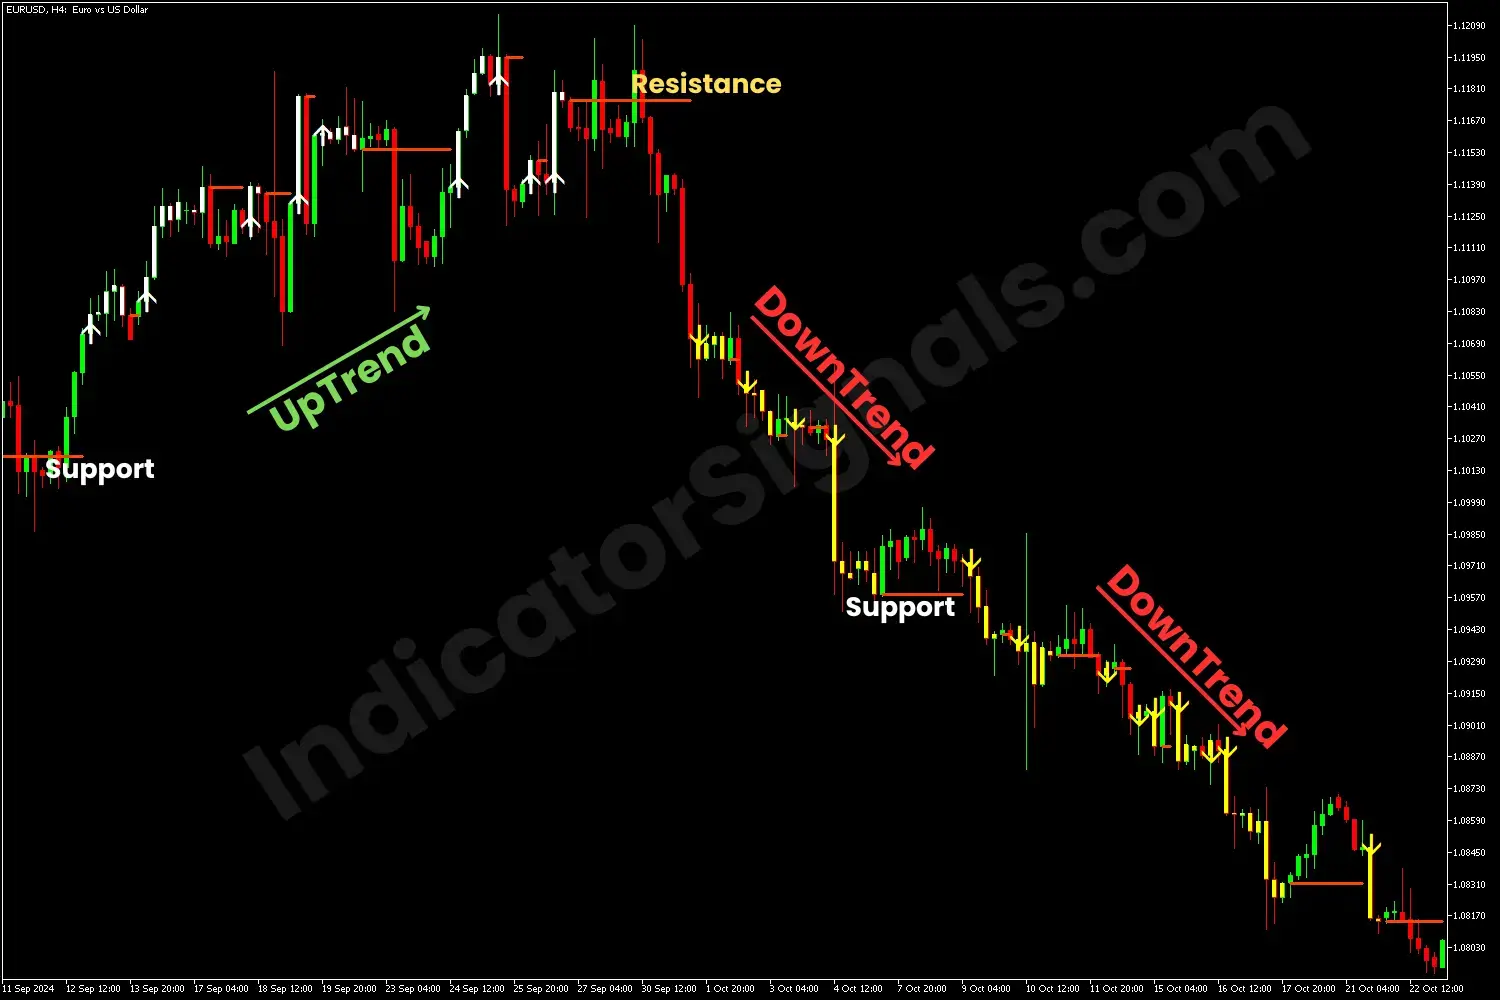
In the EURUSD chart example on MT5, the bullish momentum is confirmed by the appearance of white-colored candles and arrows, indicating a continuation of the uptrend. As the price reaches the resistance line at the higher high, it drops and is confirmed with yellow-colored candles and arrows, signaling the reversal to a downtrend, and the trader should now enter a short position and close the long one.
It is recommended to combine this indicator with other technical indicators such as MA to confirm the trend's strength, RSI to avoid entering overbought or oversold conditions, and volume indicators to validate breakouts.
IndicatorSignals.com - Owned & Operated By
FINANSYA LAB
|
2026 © All Rights Reserved.


