Version:
1.0
Updated:
02 June 2025
Downloads:
0
The Dynamic Zone RSI indicator on MetaTrader 5 is a modified version of the classic Relative Strength Index (RSI) that dynamically displays its oversold and overbought levels based on market conditions. Available on the MT4 platform as well, this indicator helps traders identify trend reversals, based on the two levels, and divergence opportunities, in order to make more accurate trade decisions.
The Dynamic Zone RSI is a refined oscillator that builds upon the traditional Relative Strength Index (RSI) by replacing the standard fixed overbought and oversold thresholds (typically set at 70 and 30) with adaptive, dynamic zones. These zones adjust in real time based on market volatility and behavior, offering a more responsive and context-aware analysis of price momentum.
This dynamic approach significantly enhances signal reliability, allowing traders to interpret market sentiment, identify divergences, and confirm trend direction with greater accuracy. Additionally, the indicator typically includes a middle line, which acts as a trend bias filter, helping them determine whether to prioritize long or short entries.
- Trend Confirmation:
- When the RSI line consistently stays above the middle line, it confirms a bullish market structure and strengthens the case for long positions.
- Conversely, when the RSI remains below the middle line, it reflects bearish momentum, favoring short setups.
- Divergence Signals:
- A bullish divergence occurs when the price forms lower lows while the RSI prints higher lows, indicating a potential trend reversal to the upside.
- A bearish divergence forms when the price makes higher highs but the RSI shows lower highs, often preceding a downward reversal.
- Market Condition Assessment:
- When the RSI line moves above the dynamic overbought zone, it may signal that the asset is overextended, highlighting a potential bearish reversal and a selling opportunity.
- When the RSI line dips below the dynamic oversold zone, it indicates a potential bullish reversal, presenting a buying opportunity.
By adapting to prevailing market conditions, the Dynamic Zone RSI provides a more flexible and insightful tool than its static counterpart. When combined with other technical analysis tools, such as volume indicators, trendlines, or candlestick patterns, it can significantly improve trade timing, risk management, and overall strategy performance.
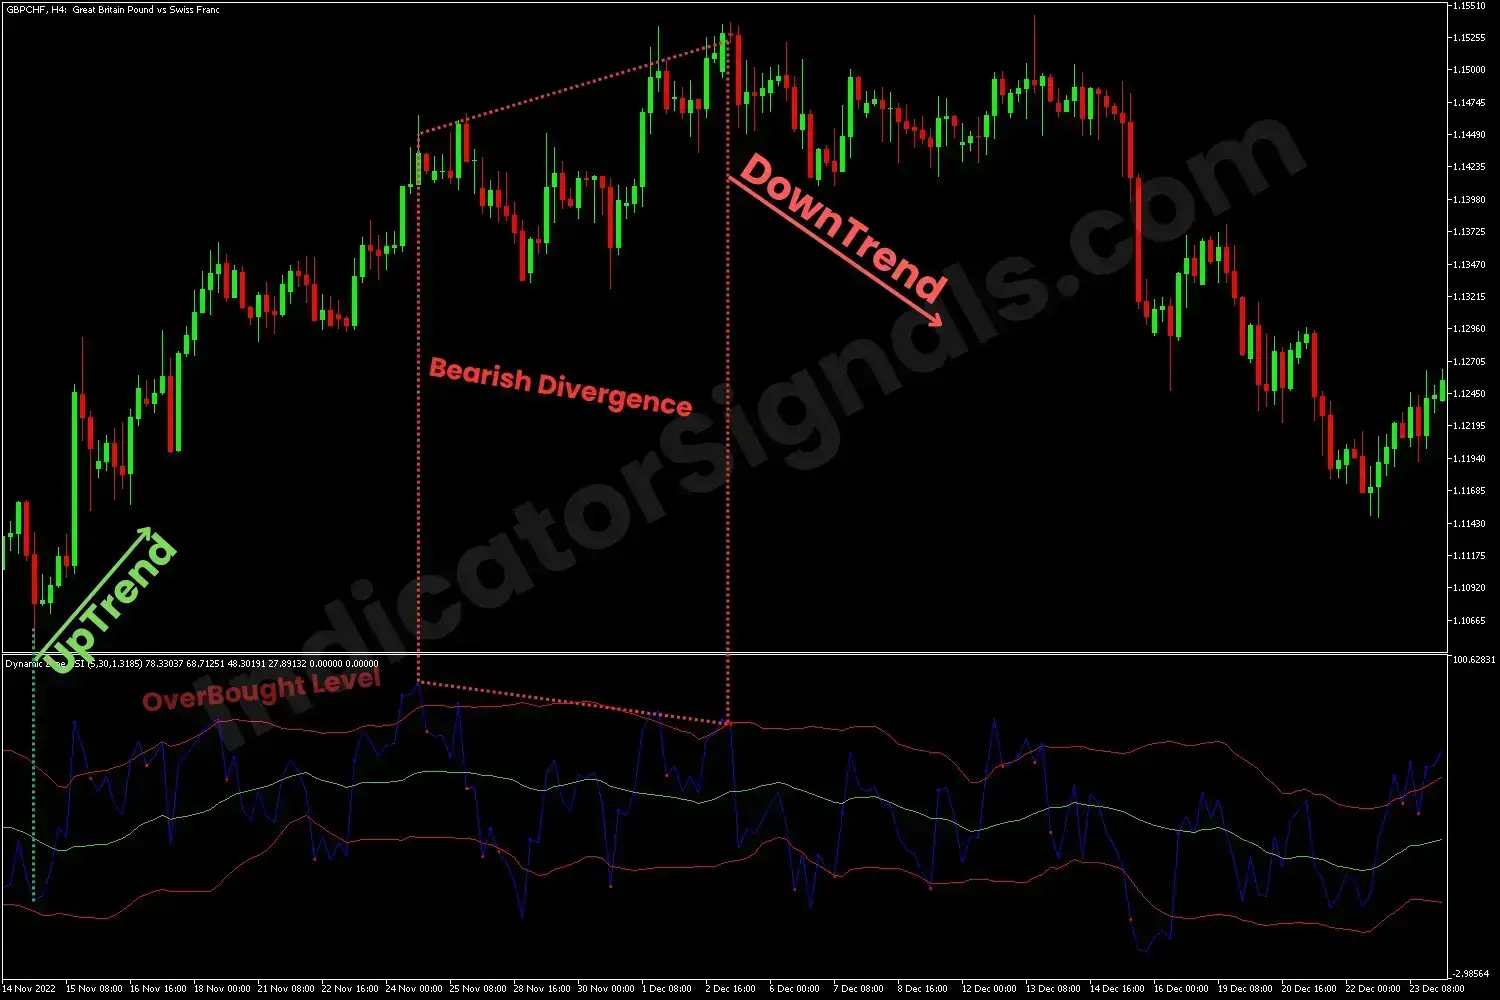
1/ In the GBPCHF trading example on the MetaTrader 4 chart, the Dynamic Zone RSI provides multiple insightful signals. Initially, when the RSI line rebounds from the dynamic oversold zone, it indicates a potential bullish reversal. This upward movement is further validated as the RSI crosses above the middle line, confirming bullish market dominance during that period. Throughout the uptrend, the RSI enters the dynamic overbought zone on several occasions, offering short-term sell signals during corrective phases of the bullish move.
Later, as the price action forms higher highs, the RSI begins to print lower highs, signaling a bearish divergence, a warning of a possible trend reversal. Once the RSI breaks below the overbought level and subsequently drops beneath the middle line, it confirms bearish momentum, offering traders a strong short-selling opportunity.
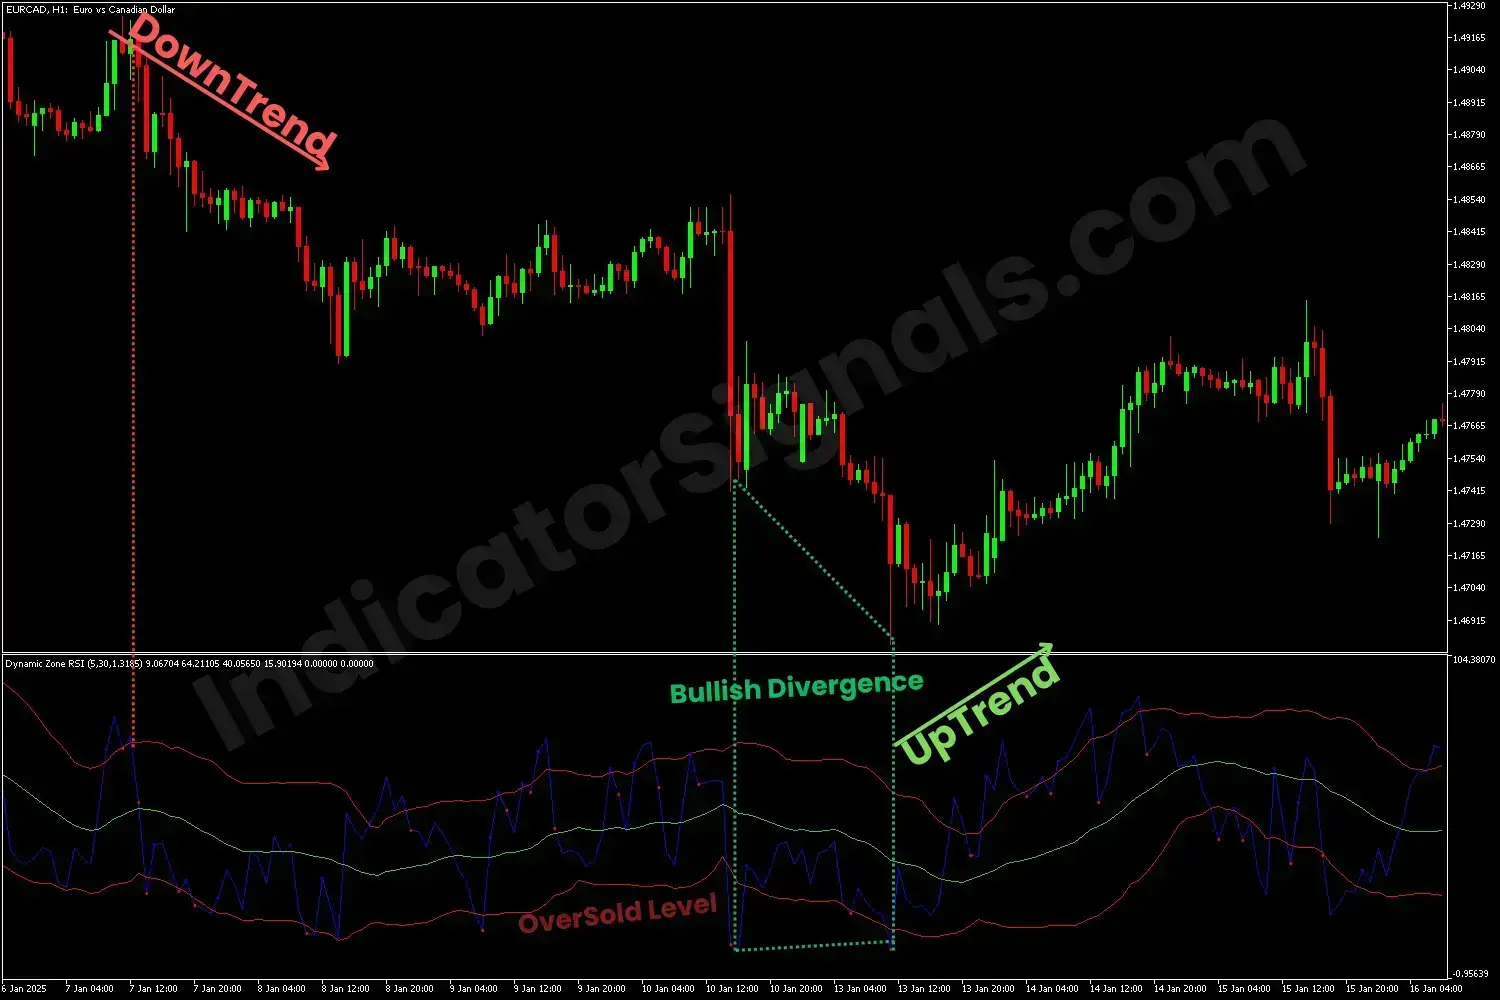
2/ In the EURCAD trading example on the MetaTrader 5 chart, the indicator similarly proves effective. As the RSI line retreats from the overbought zone, it signals the start of a bearish trend. The middle line shifts downward, reinforcing the prevailing bearish market sentiment. During this downtrend, the RSI reaches the dynamic oversold zone several times, each instance providing traders with potential long entries aligned with temporary corrective phases within the bearish structure.
Toward the end of the trend, a bullish divergence is observed: the price makes lower lows, while the RSI forms higher lows, suggesting a weakening bearish trend. When the RSI climbs above the oversold zone, and subsequently crosses the middle dynamic line, it confirms a bullish reversal, offering a strong buying opportunity.
IndicatorSignals.com - Owned & Operated By
FINANSYA LAB
|
2026 © All Rights Reserved.


