Version:
1.0
Updated:
25 February 2025
Downloads:
0
The Donchian Ultimate Indicator on MT4 is a technical analysis indicator that calculates the highest high and lowest low on the chart, forming support and resistance levels, while incorporating additional filters and smoothing options, compared to the classic donchian channel indicator, for improved accuracy. Furthermore, on MetaTrader 5, this indicator aids traders in identifying the trend’s strength, volatility, and spot breakout points, to refine entry and exit points, and risk management.
The Donchian Ultimate Indicator is a trend-following indicator, designed to provide traders with enhanced insights into market movement and price breakouts, by shaping dynamic support and resistance levels.
This ultimate indicator can be used for several strategies in trading such as:
- Trend-following strategy: Use the middle Donchian line as a dynamic trend filter: Above this line, indicates an uptrend, and below it, a downtrend.
- Volatility-based strategy: If the resistance and support spans diverge, it indicates increasing volatility, if they converge, suggests market consolidation.
- Breakout strategy: When the price breaks above the upper line, it indicates a bullish momentum, and when it breaks below the lower line, suggests a bearish trend.
Additionally, traders can use the two channels for entry, setting the stop-loss, above the upper span for sell trades, and below the lower span for buy trades, as well as determining the take-profit point.
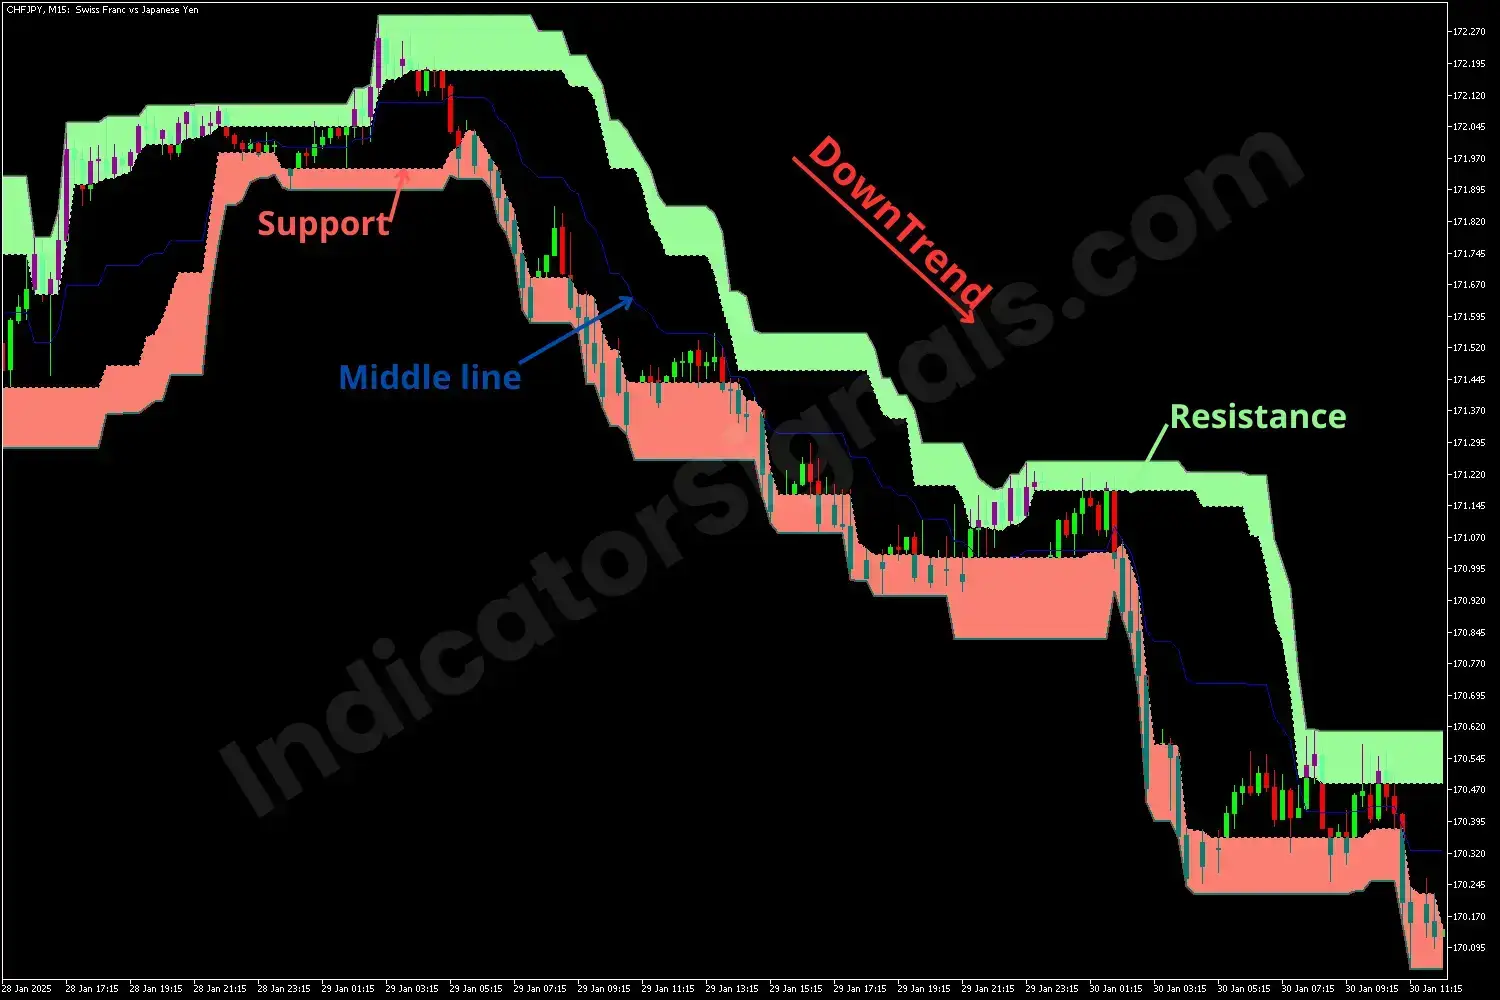
For the first example on MT4, at the top of the CHFJPY chart, the two spans converge, presenting a consolidation phase. As they diverge, the blue line moves downward, suggesting a downward trend. When the price breaks below the support line, that confirms the bearish movement, offering the trader to enter a short position, set a stop-loss near the resistance line, and aim for a 1:2 risk-reward ratio.
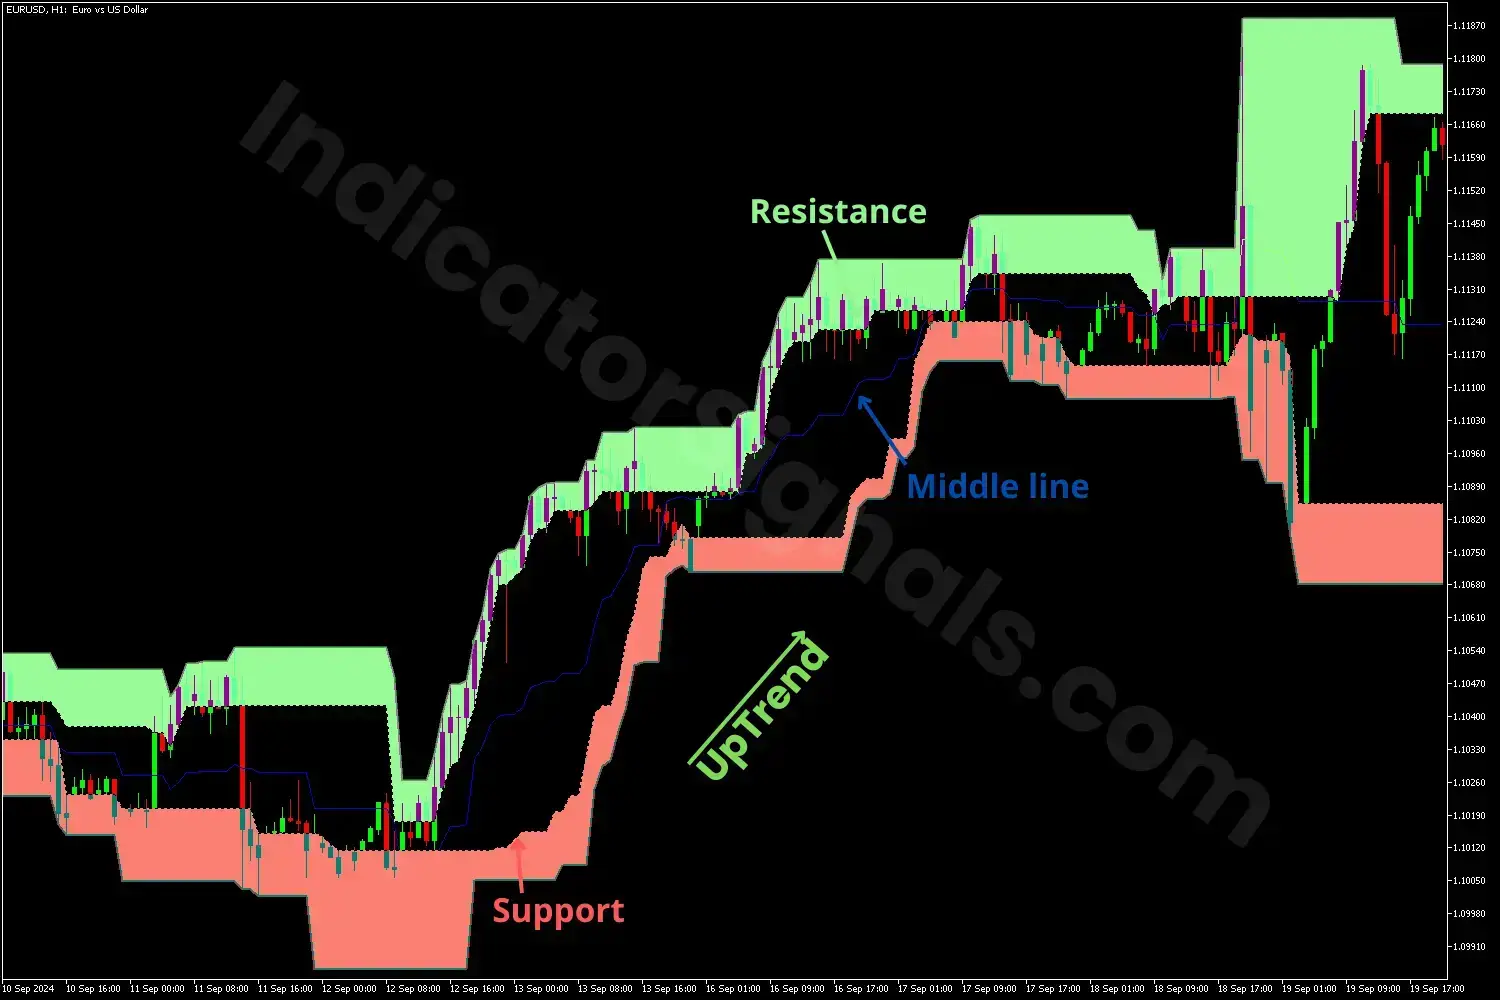
For the second example on MT5, at the beginning of the EURUSD chart screenshot, the market initially moves sideways as the two channels converge. As they begin to move away from each other, the middle line goes up, suggesting a bullish movement. As the price breaks above the resistance line, that confirms the upward trend, and the trader should enter buying, setting a stop-loss near the support line, and target a 1:2 risk-reward ratio.
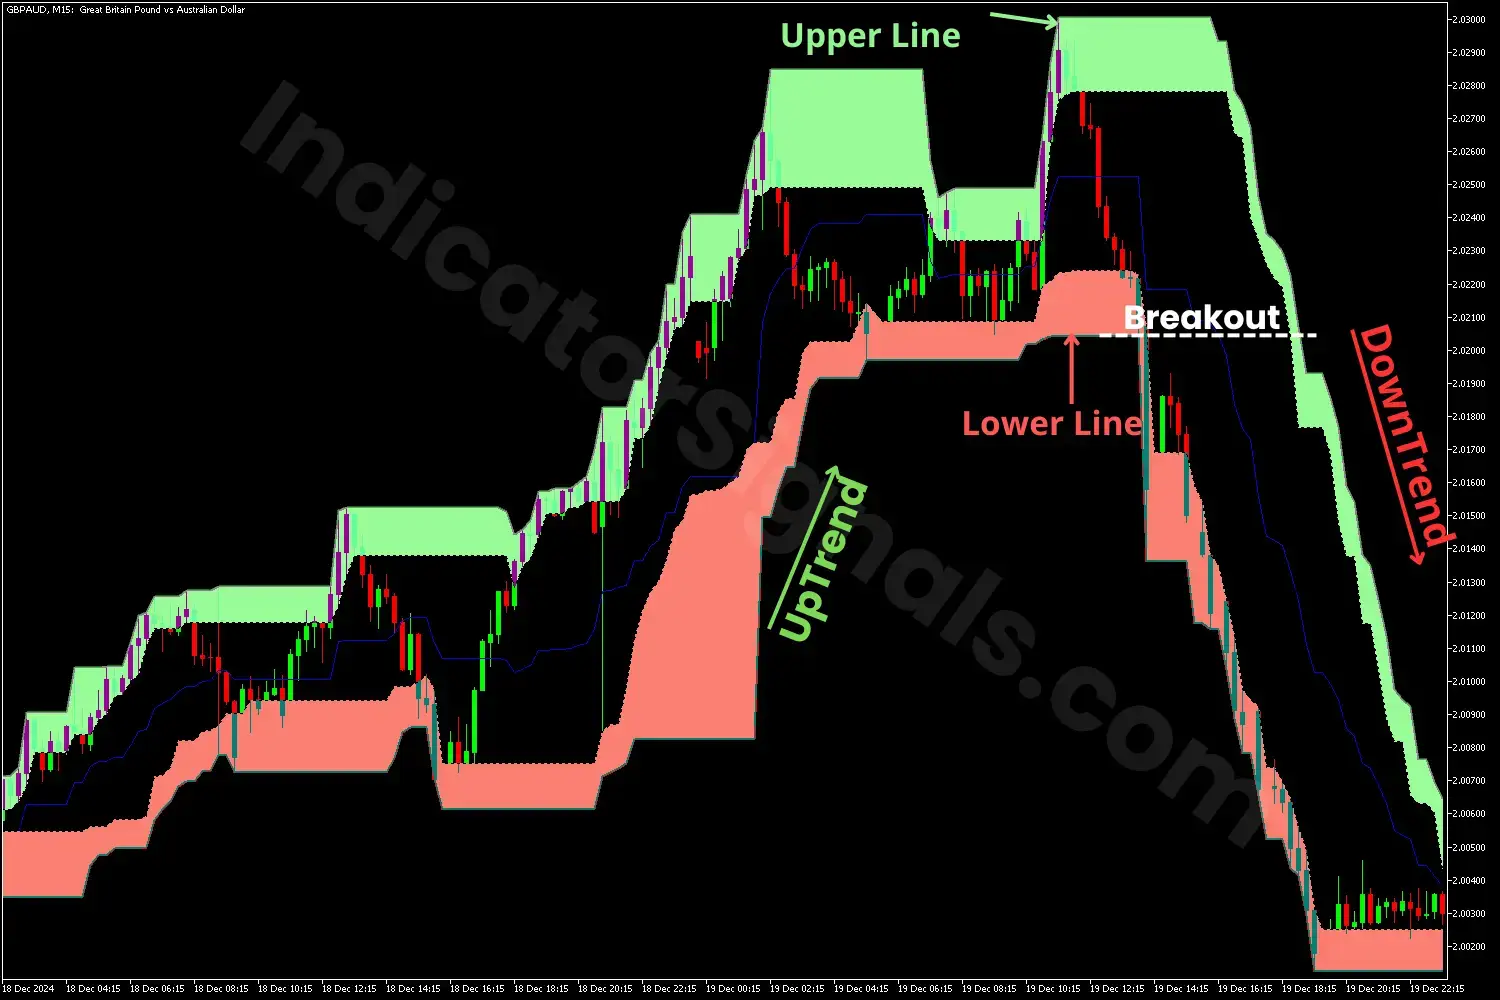
In the third MetaTrader 5 example, toward the end of the uptrend, the price struggles to break above the upper line and instead ranges between the two channels until it breaks the lower line, suggesting a potential trend reversal. And when the middle line starts declining and the two spans diverge as well, it confirms the breakout and signals a downward trend.
For making the best trading decision, it is recommended to combine this indicator with trend indicators like moving averages or ADX for confirmation.
IndicatorSignals.com - Owned & Operated By
FINANSYA LAB
|
2026 © All Rights Reserved.


