Version:
1.0
Updated:
06 May 2025
Downloads:
0
The DMI Stochastic Extreme is a technical analysis indicator for MetaTrader 5 that combines two classic indicators, the Directional Movement Index (DMI) and the Stochastic Oscillator. Also available on the MT4 platform, this indicator identifies overbought and oversold conditions within trending markets and is designed to detect momentum extremes and trend exhaustion. Highlighting potential reversal zones enables traders to anticipate turning points and optimize entry and exit timing for enhanced trade execution.
The DMI Stochastic Extreme merges the utility of two time-tested technical indicators: the Directional Movement Index (DMI) and the Stochastic Oscillator. This hybrid approach is designed to uncover trend direction and momentum exhaustion, making it ideal for spotting high-probability reversals.
However, the indicator begins by calculating the ADX (Average Directional Index) with +DI and –DI values from the DMI framework to measure the market's trend direction and intensity. Instead of applying the Stochastic Oscillator to price, it performs a stochastic analysis directly on the +DI and –DI values.
Furthermore, traders often apply this indicator using two main trading strategies:
- Overbought and oversold conditions:
- When the indicator line exceeds the 90 level and turns green, it suggests the market is overbought, indicating a potential bearish reversal.
- When the line drops below the 10 level and turns red, it reflects an oversold condition, pointing to a possible bullish reversal.
- Divergence signals:
- A bearish divergence occurs when the price forms higher highs, but the indicator forms lower highs near its upper extreme, signaling weakening upward momentum and a possible sell opportunity.
- A bullish divergence appears when the price forms lower lows, while the indicator forms higher lows near its lower extreme, suggesting fading bearish pressure and a potential buy opportunity.
The DMI Stochastic Extreme Indicator offers a refined perspective on momentum by applying stochastic logic to directional movement rather than price. Its ability to identify overextended trends and divergence-based reversals makes it a must-have tool for traders.
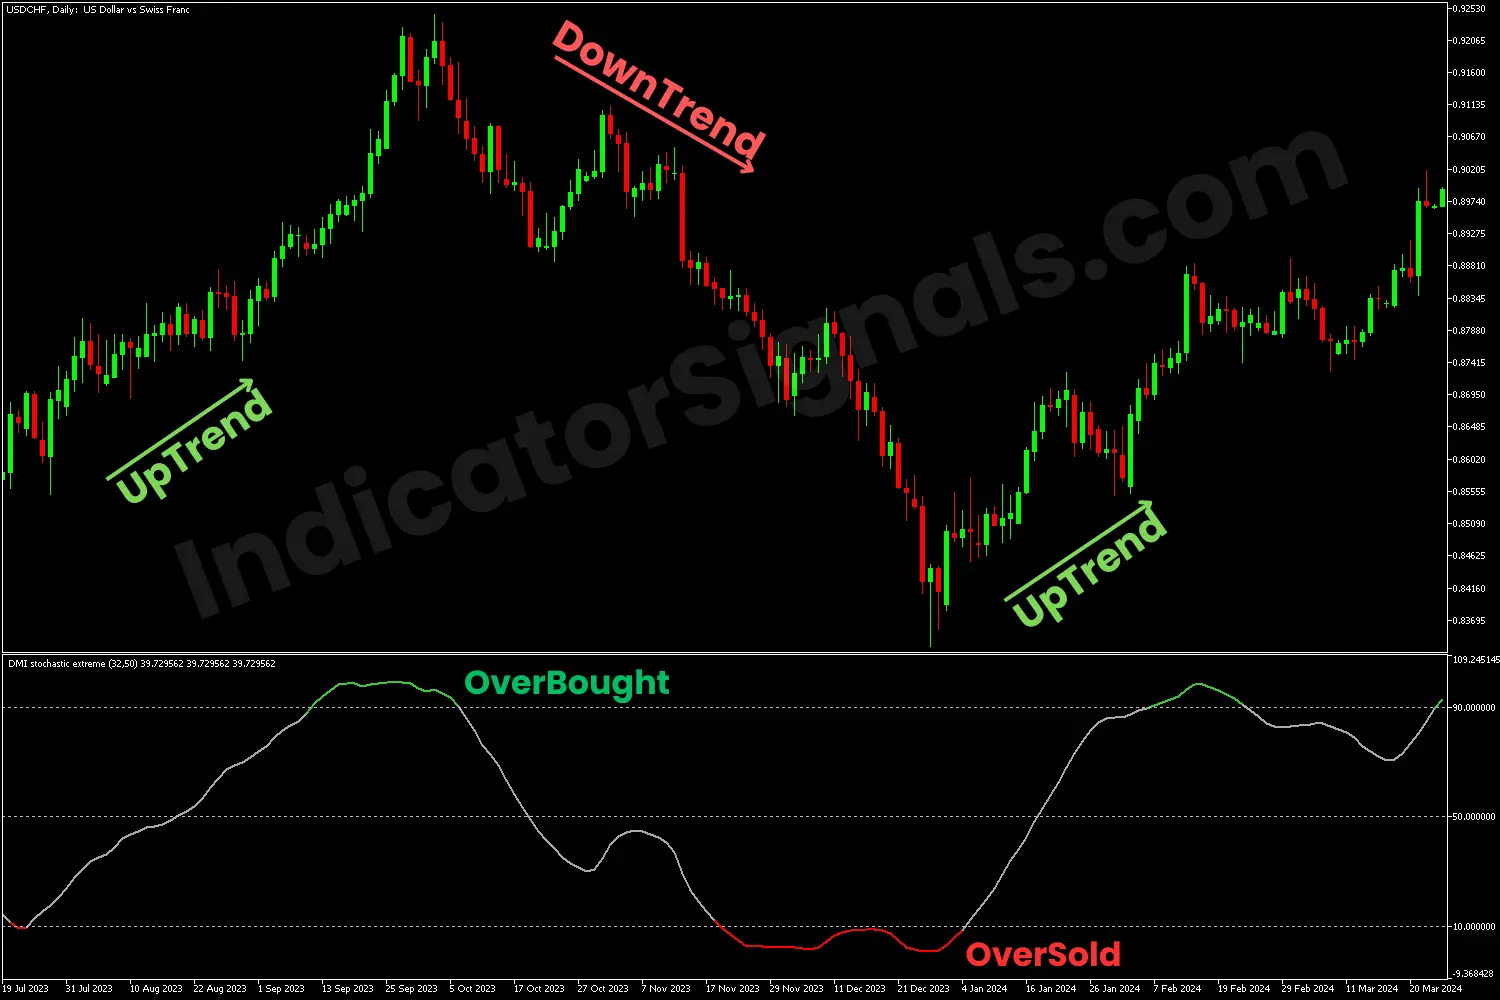
1/ On the USDCHF daily chart, applying the MT5 version of the DMI Stochastic Extreme Indicator confirmed an ongoing uptrend as the indicator crossed above the 50 level. As it climbed past 90 and turned green, it signaled an overbought condition, prompting traders to exit long positions and prepare for potential short entries.
That is exactly what happened, with the price declining until the indicator dropped below 10 and turned red, signaling an oversold state. This suggested it was time to exit short trades and consider buying, which was followed by a clear upward price move.
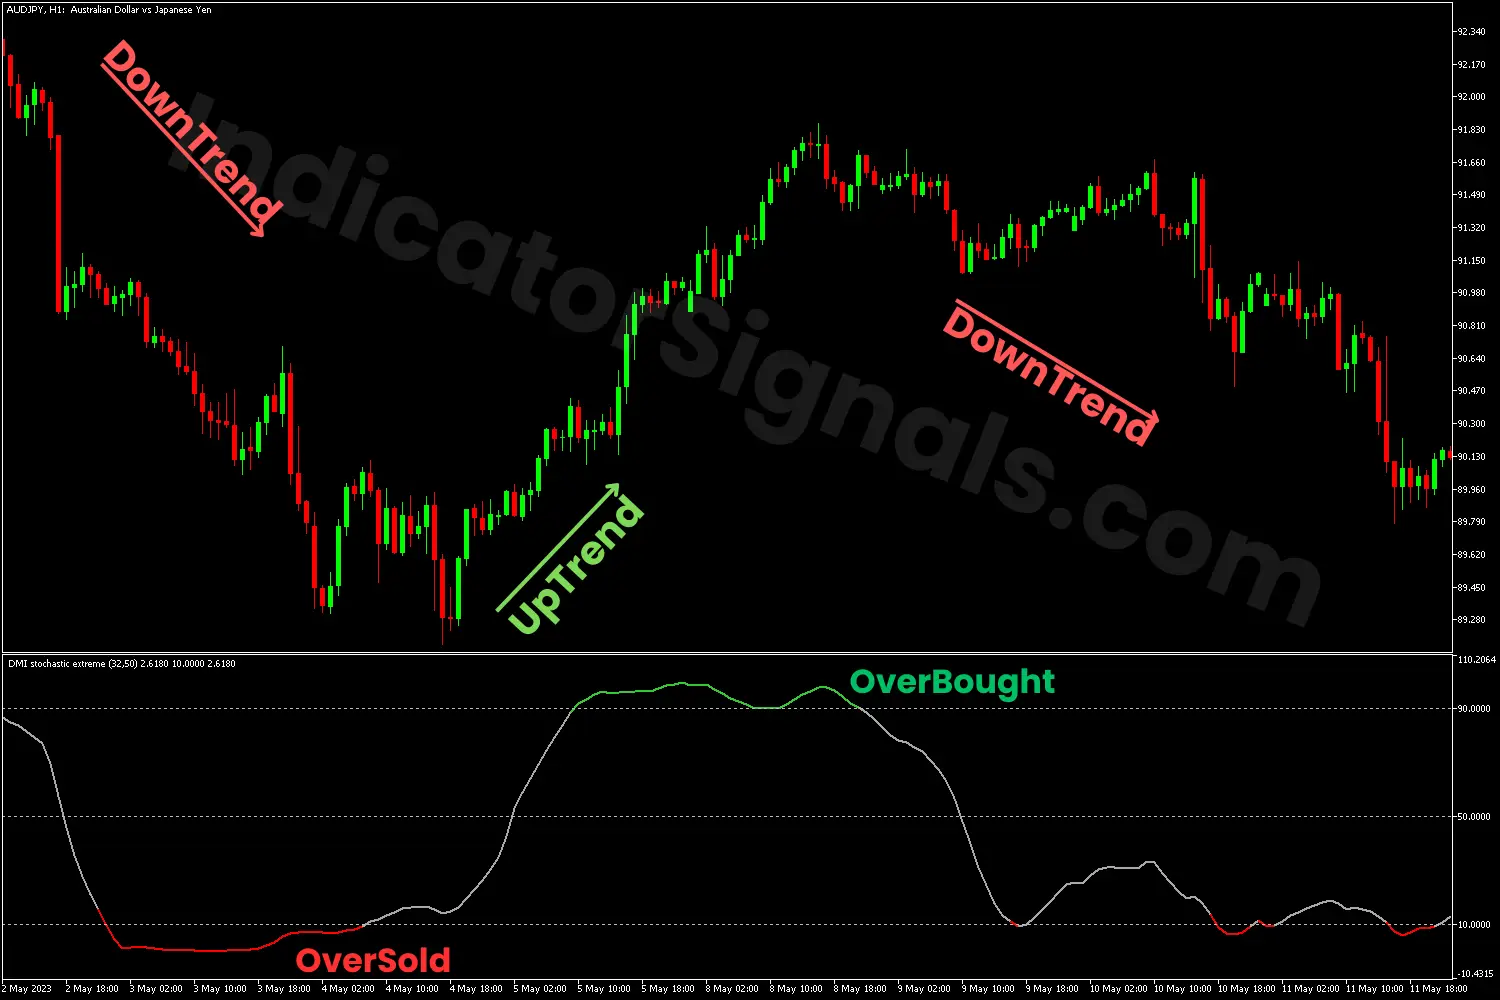
2/ On the AUDJPY H1 chart, applying the MT4 version of the DMI Stochastic Extreme Indicator confirmed an ongoing downtrend as the indicator crossed below the 50 level. As it fell under 90 and turned red, it signaled an oversold condition, providing traders to exit short positions and prepare for potential long entries.
The market responded, with the price rising until the indicator broke above 90 and turned green, signaling an overbought state. This suggested it was time to exit buying trades and consider selling, which was followed by a clear downward price move.
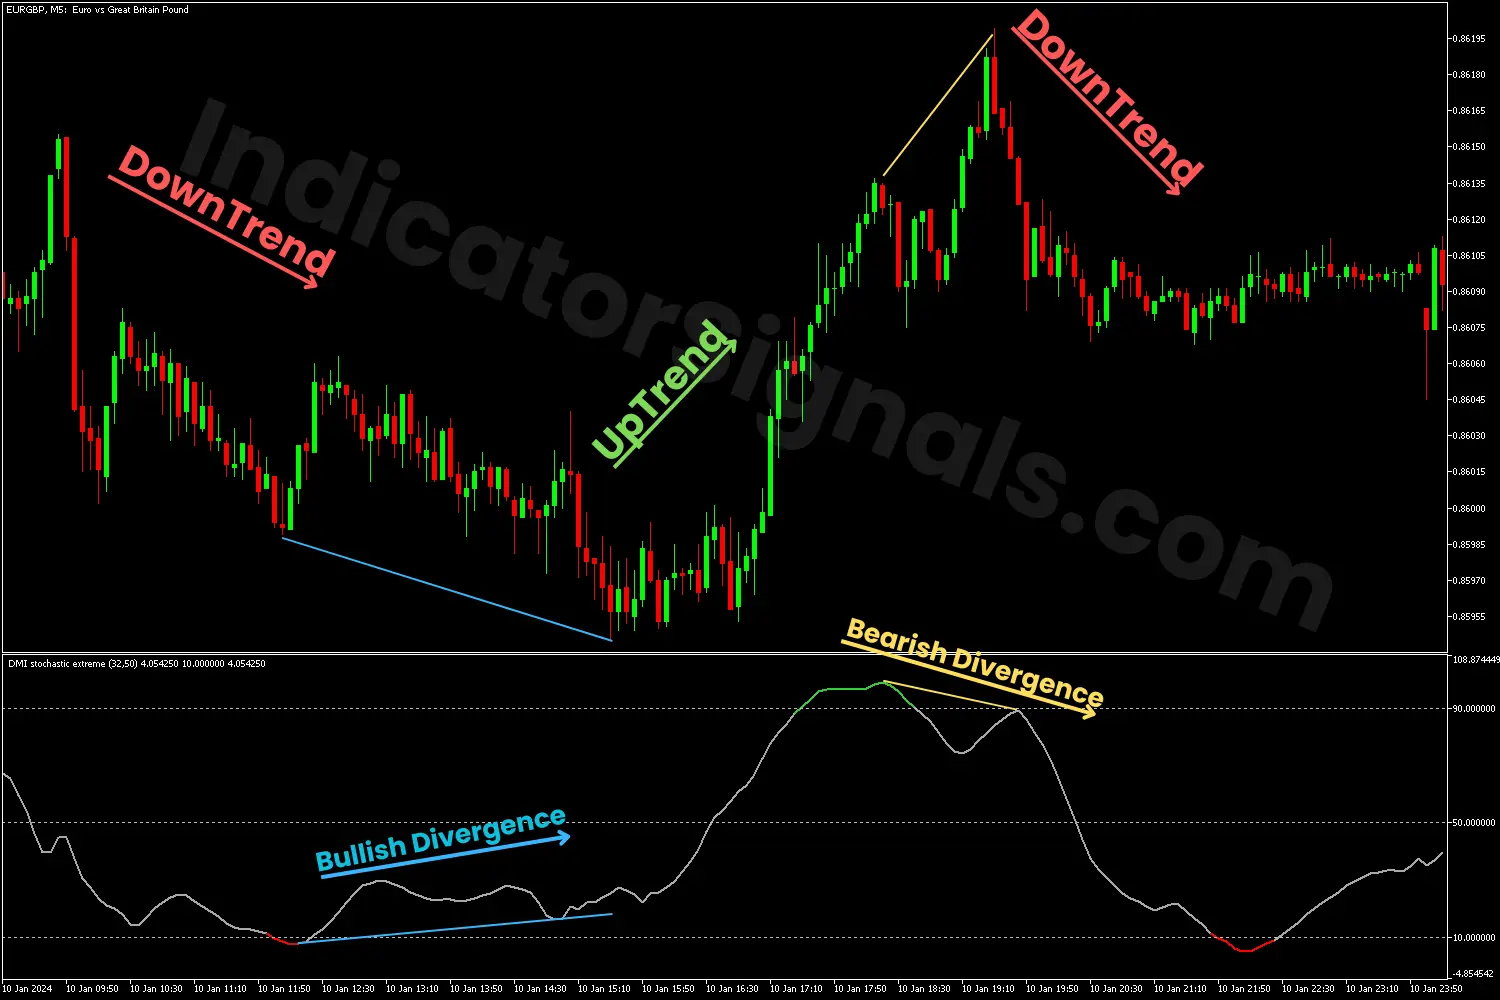
3/ On the EURGBP M5 chart on MetaTrader 5, applying the DMI Stochastic Extreme Indicator revealed a potential bullish divergence near the end of a downtrend, where the price formed lower lows, but the indicator showed higher lows. A strong bullish candle confirmed the reversal, offering a buy entry.
As the price continued upward, it formed higher highs, while the indicator showed lower highs, signaling a bearish divergence. The appearance of a bearish candle provided a valid sell signal, allowing traders to profit from both the upward and downward moves.
IndicatorSignals.com - Owned & Operated By
FINANSYA LAB
|
2026 © All Rights Reserved.


