Version:
1.0
Updated:
02 April 2025
Downloads:
2
The DMH (Directional Movement using Hann Windowing) Indicator on MetaTrader 4 is an improved version of the Directional Movement Index (DMI). It applies Hann windowing, a digital signal processing technique, to enhance trend detection by reducing market noise and smoothing price data. Available on the MetaTrader 5 platform, this indicator helps traders identify strong trends and potential reversals.
The Directional Movement using Hann Windowing is classified as a trend-following indicator, developed by John Ehlers, that improves upon the traditional DMI utilizing Hann windowing, a technique that enhances signal clarity while minimizing lag.
Furthermore, this indicator provides a clearer view of market trends through a line that fluctuates around the zero level. It is color-coded, with lime indicating bullish movement and red signaling bearish momentum.
However, the DMH is often used by traders looking to filter false signals, confirm trends direction, and identify high probability trend reversals.
- Trend confirmation:
- When DMH values rise above the zero line, with a lime colored line, it signals a strong bullish momentum and a long opportunity.
- When DMH values drop below the balance line, with a red colored line, it signals a strong bearish momentum and a short opportunity.
- Filter false signals:
* If the indicator remains below the zero level but displays a bullish line, a buying opportunity is not confirmed until additional confirmation signals.
* If the indicator stays above the balance level but displays a red line, a selling entry is not confirmed until additional confirmation signals.
- Potential reversal:
- Bullish divergence: During a downtrend, if the price forms lower lows while the indicator shows higher lows, it signals a potential long opportunity.
- Bearish divergence: During an uptrend, if the price makes higher highs while the indicator forms lower highs, it signals a potential short entry.
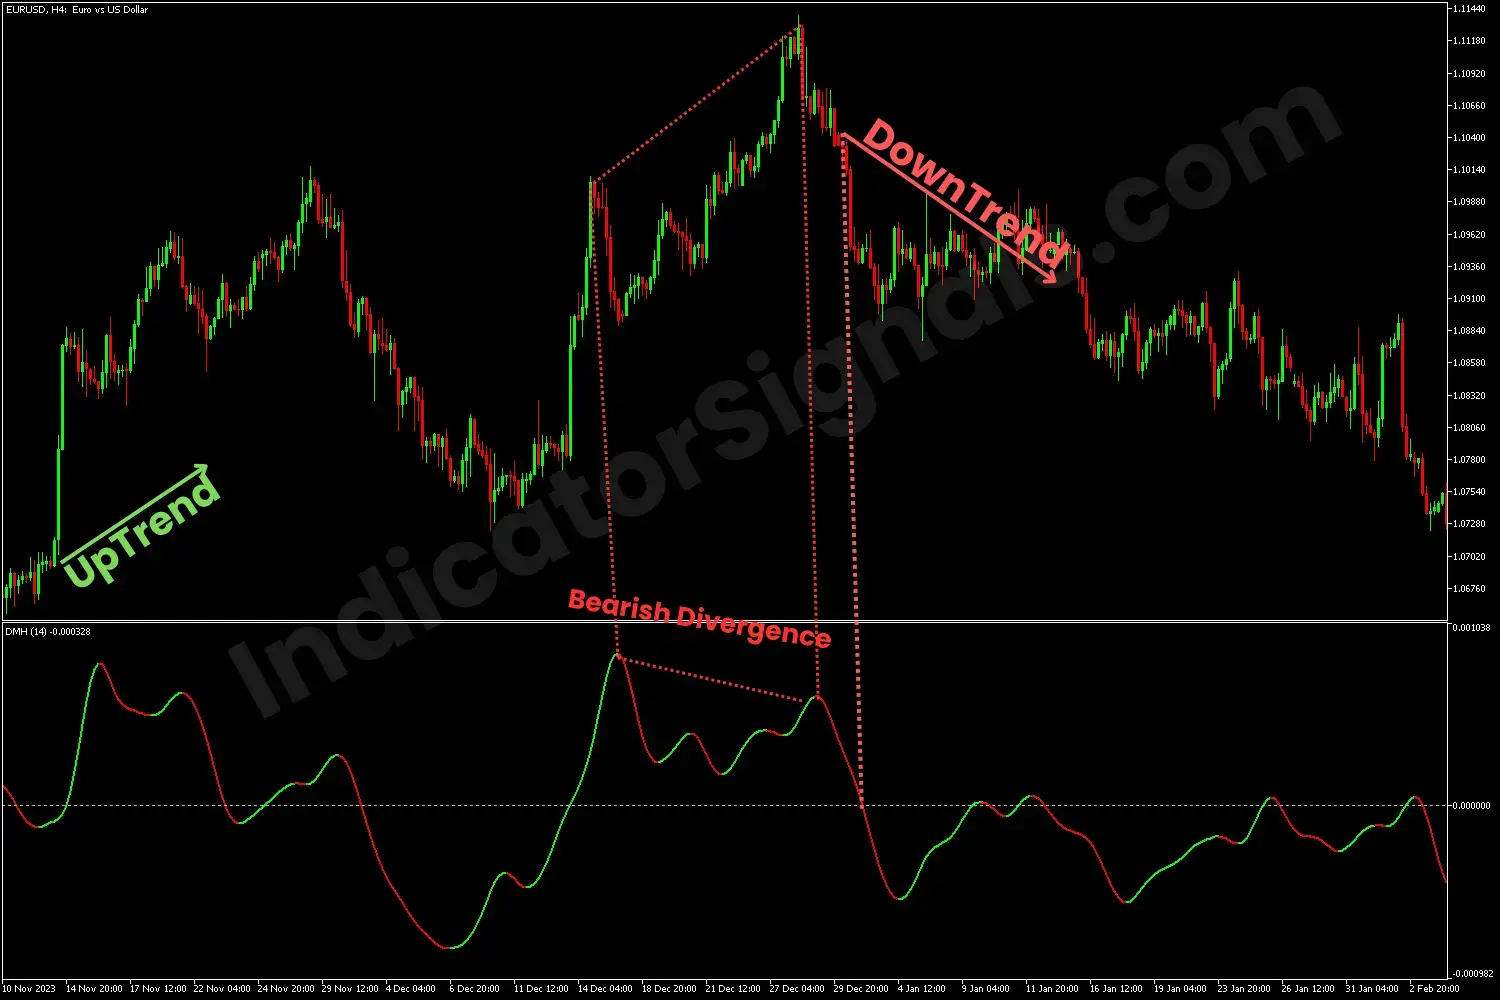
1. In the first trading example on MetaTrader 4, when the indicator breaks above the zero level, turning to a Lime color, it signals the start of a bullish momentum. During the upward trend, any rebound from the balance line or any break above it may be considered a new long entry.
Near the trend's end, a bearish divergence begins to form as the price continues to reach new highs, but the indicator moves in the opposite direction, signaling the beginning of a downward trend and a short entry.
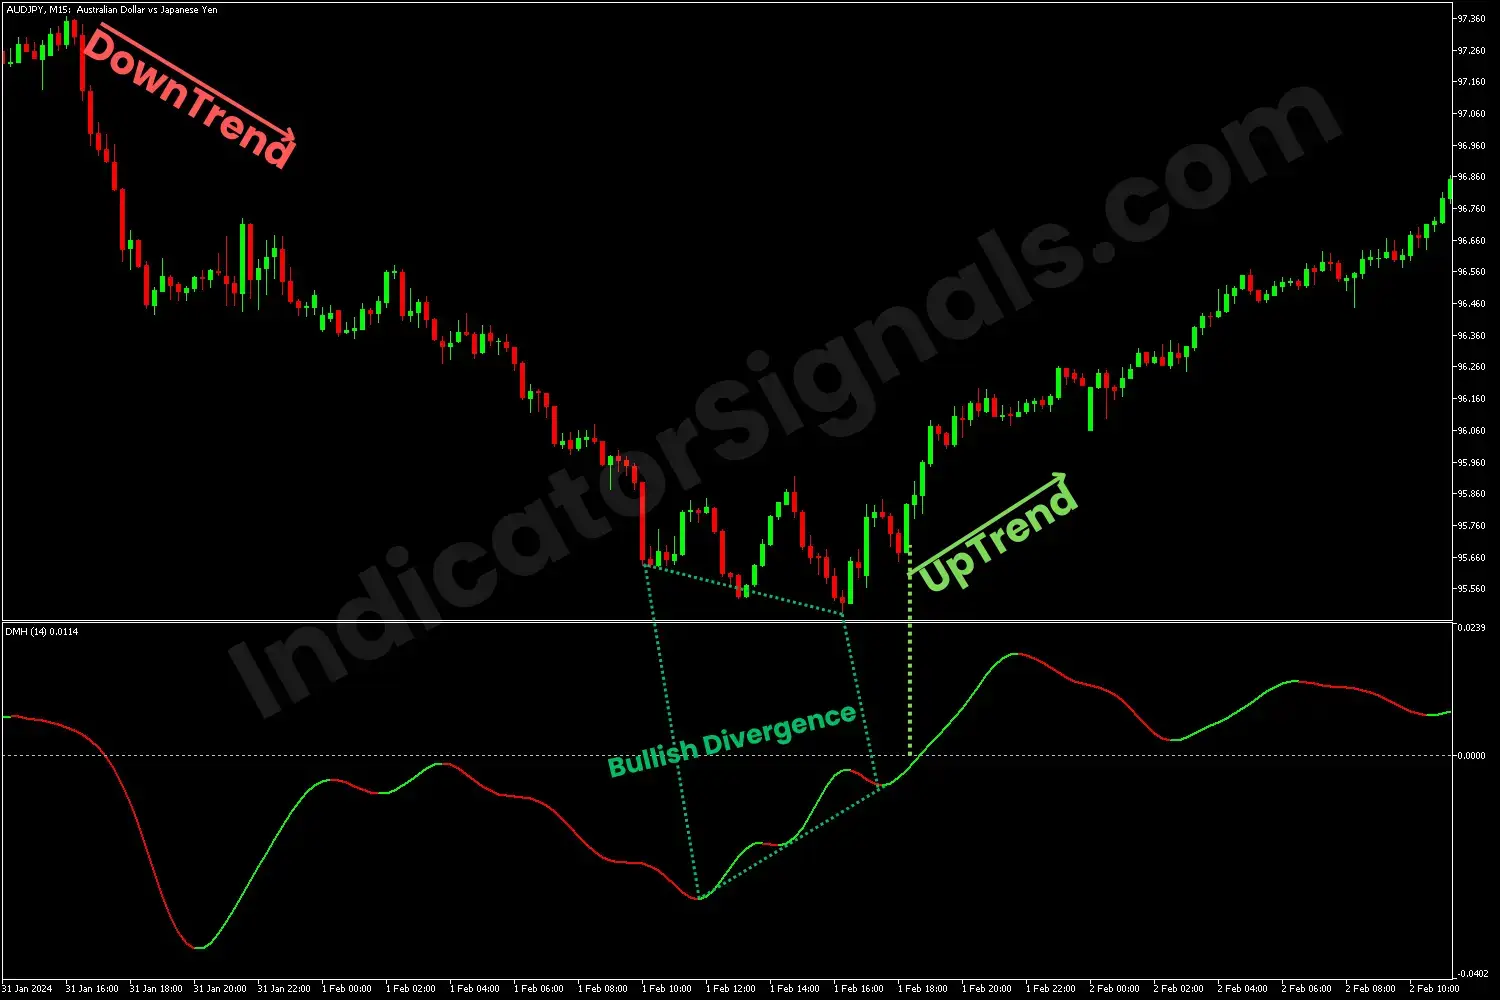
2. In the second trading example on MetaTrader 5, when the indicator drops below the balance line, turning into a red color, it signals the start of a bearish momentum. During the downward trend, any rebound from the zero level or any re-break below it may be considered a new short opportunity.
Toward the trend's end, a bullish divergence begins to form as the price continues to reach new lows, but on the other hand, the indicator moves up, signaling the beginning of an upward trend and a long entry.
IndicatorSignals.com - Owned & Operated By
FINANSYA LAB
|
2026 © All Rights Reserved.


