Version:
1.0
Updated:
07 April 2025
Downloads:
0
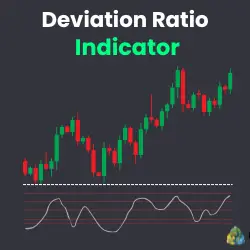
The Deviation Ratio (DR) on MetaTrader 5 is a technical analysis indicator that compares short-term and long-term volatility by dividing two standard deviations. This indicator is also available for free on the MT4 platform. Moreover, the DR helps traders identify trend strength, determine momentum shifts, and plot potential reversals.
The Deviation Ratio indicator is a volatility-based tool that measures the relation between short-term and long-term standard deviation. It reflects how strongly the current price moves compared to its longer-term behavior.
However, traders often used the DR to detect momentum changes, volatility breakouts, and trend continuation or exhaustion zones, following these two simple analyses:
- When the ratio rises, short-term volatility accelerates, signaling possible breakout conditions or trend continuation.
- When the ratio falls, the market is in a consolidation phase or prepares for a reversal.
To make trading strategies based on this indicator more simple and accurate, in both MT4 and MT5 versions, we add five levels (1.5, 1.2, 0.9, 0.7, and 0.6) to detect the best entry and exit points for the following strategies:
- Trend continuation strategy:
- When the ratio rises above 0.9, it signals increasing short-term momentum.
- If it continues above 1.2 or 1.5, the trend is strong, and traders can enter in the direction of the trend, holding existing trend positions or exiting opposite trend positions.
- Trend reversal strategy:
- When the ratio drops below 0.7, market volatility weakens.
- If it falls below 0.6, it's a potential oversold or overbought zone:
* Traders should exit their existing positions and wait for a confirmation to enter counter-trend trades.
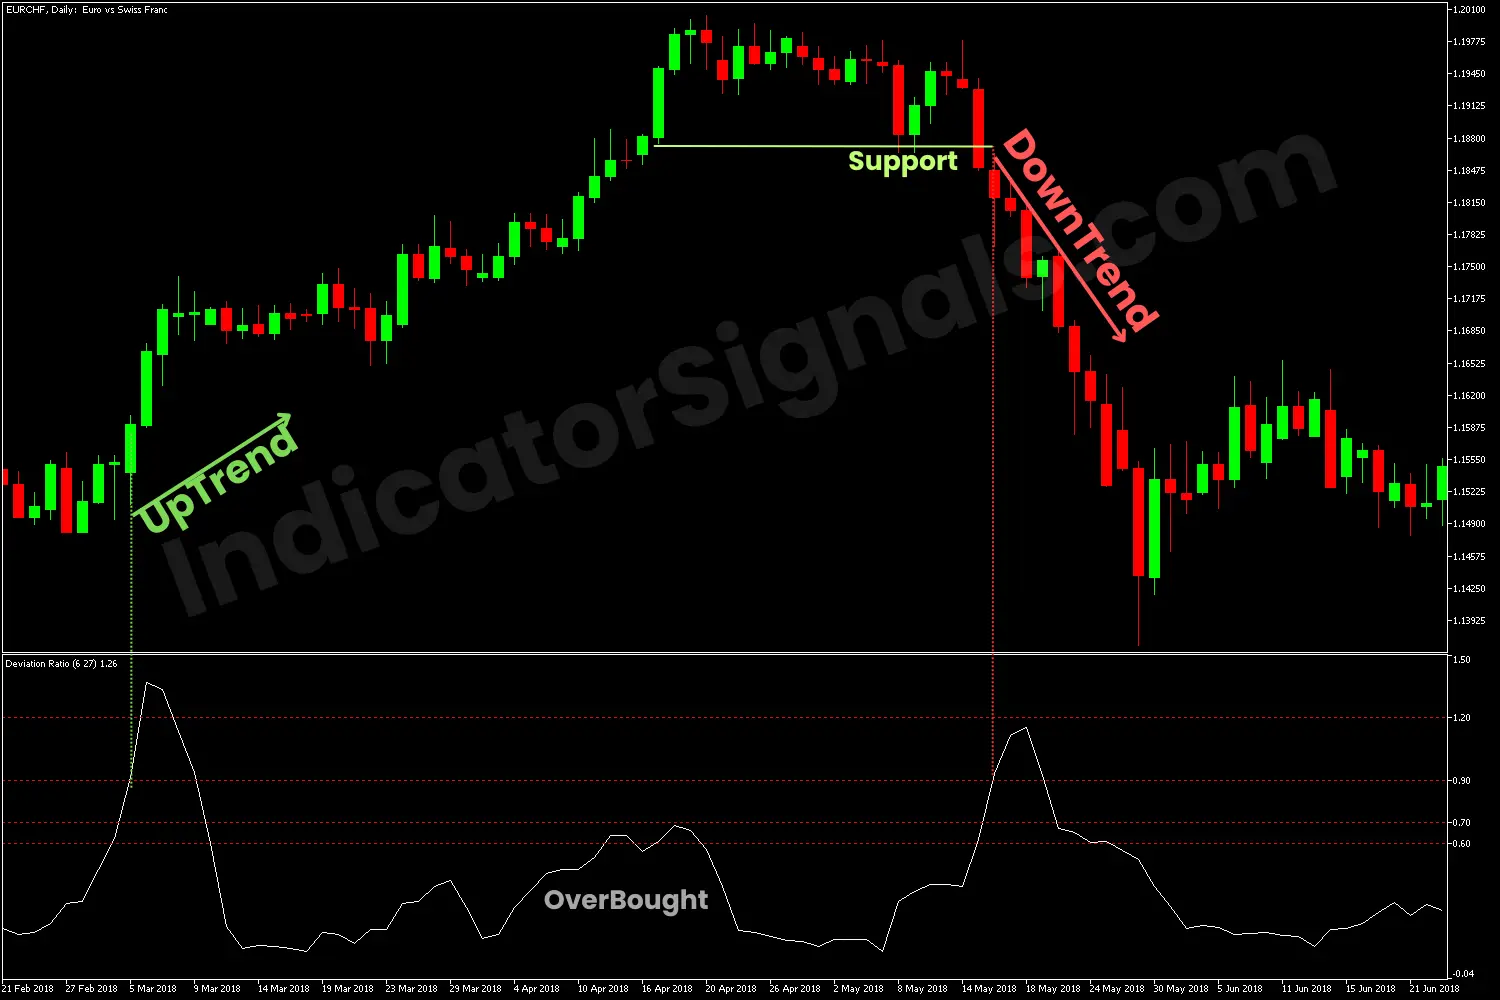
1- In the first trading example on MetaTader 4, during the uptrend, when the DR indicator rises above the 0.9 level and then breaks above the 1.2, it signals a strong bullish momentum. Toward the trend's end, the indicator falls under all the levels, entering the overbought zone, in this scenario, indicating a weakness of the trend and a potential trend reversal.
When a bearish candle breaks below the last support of the uptrend, with the rising of the deviation ratio, both signal the beginning of the downward trend, and the trader should exit his long position and enter short for the EURCHF pair.
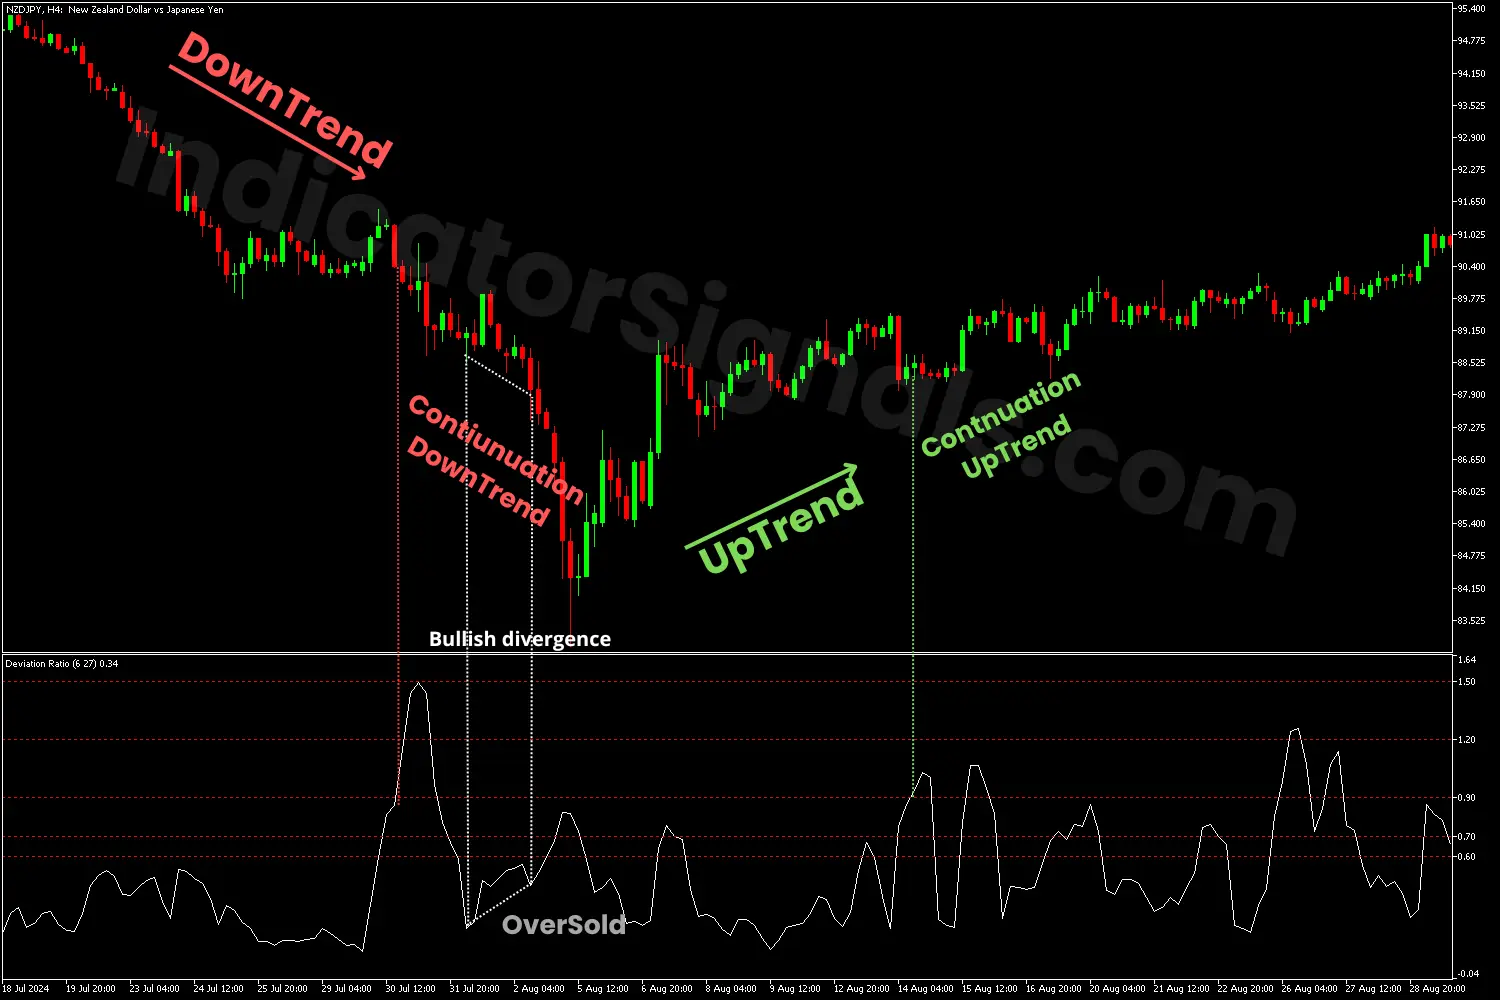
2- In the second trading example on MetaTrader 5, during the downtrend, when the DR indicator moves above 0.9, followed by breaking above 1.2, it signals a strong bearish momentum and a continuation of the trend direction. Near the trend's end, the indicator drops under all the levels, entering the oversold zone, suggesting a weakness of the trend and a potential reversal.
Spotting a bullish divergence between the indicator and the price signals a bullish reversal, and the trader should exit his short position and wait for a confirmation to enter long on the NZDJPY pair. With the rising of the ratio above the 0.9 level, it indicates the strength of the bullish movement and a good long entry point.
IndicatorSignals.com - Owned & Operated By
FINANSYA LAB
|
2026 © All Rights Reserved.


