Version:
1.0
Updated:
03 April 2025
Downloads:
2
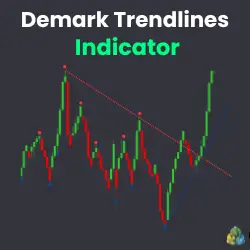
The Demark Trendlines is a technical analysis indicator on MetaTrader 5 designed to plot trendlines based on the Demark principle. These lines are drawn by identifying significant highs and lows on the price chart, helping traders visualize potential market direction, same on the MT4 platform. Moreover, the indicator displays uptrend and dowtrend lines that can be used for identifying entry and exit points for trades, as well as for confirming trend reversals.
The Demark Trendlines (D.TL) is a trend-following indicator that helps traders identify market trends by revealing upward and downward trend lines.
Developed from the concepts of market analysis by Tom Demark, this indicator determines potential reversal points in the market and uses these to draw TrenlineUP and TrendlineDown. These lines are updated dynamically as the price progresses.
- TrendlineUP: This is drawn from significant lows and projects upward.
- TrendlineDOWN: This is drawn from significant highs and projects downward.
Furthermore, traders often use the D.TL for several trading strategies, such as:
- Entry points:
- Buy Entry: This can be considered when the price bounces off the blue line (upward line) and starts moving higher. This suggests that the market is dominated by bulls, signaling a buying opportunity.
- Sell Entry: This is generated when the price rebounds from the red line (downward line) and begins dropping. This indicates that the market is dominated by bears, signaling a selling opportunity.
- Trendline Breakouts:
- Break of Uptrend Line: A break below an uptrend line could signal the end of the bullish trend and the continuation of the bearish movement.
- Break of Downtrend Line: A break above a downtrend line may suggest the end of the bearish momentum and the continuation of the bullish trend.
However, this indicator recalculate and updates its lines as price action evolves. It is recommended that traders should combine it with other categories of technical analysis indicators, such as oscillator and volume, which are available for FREE on our platform, before entering the market to ensure accurate trade decisions.
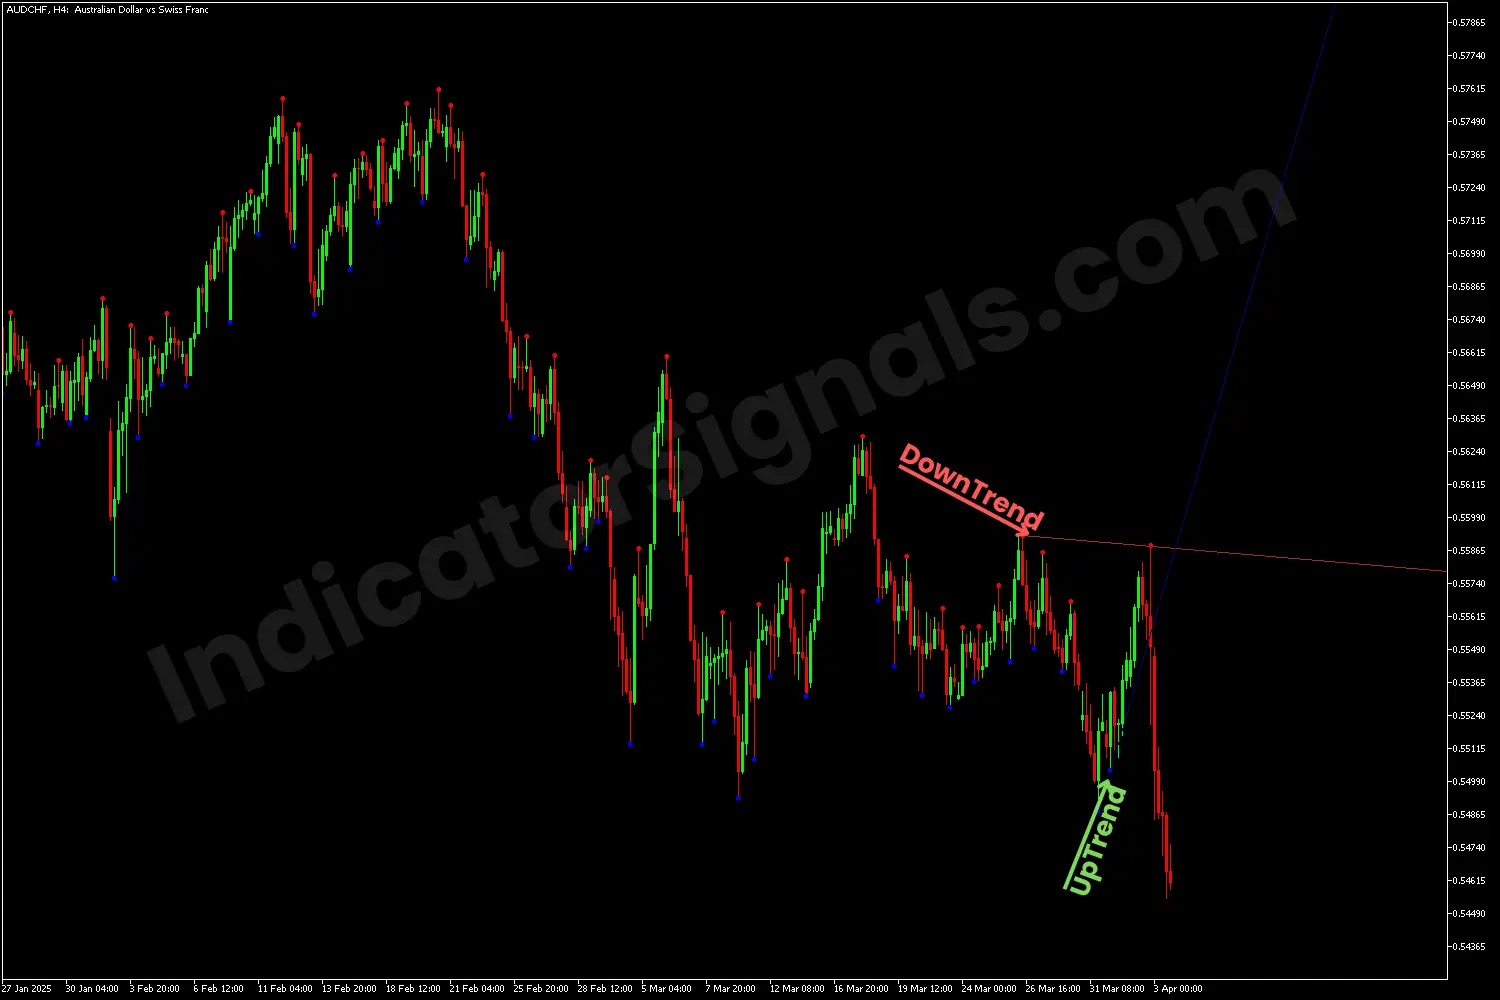
1- For the first trading example on MetaTrader 4, the indicator displays the two lines, up and down, presenting the main trend, which is bearish and a correction trend, which is bullish. Any rebounds from the blue line indicate a buying opportunity and ay bounces off the red line indicates a short signal.
When the price breaks below the trendlineUp, it signals the continuation of the bearish trend, suggesting the exit of the long position and to reenter short on the AUDCHF pair.
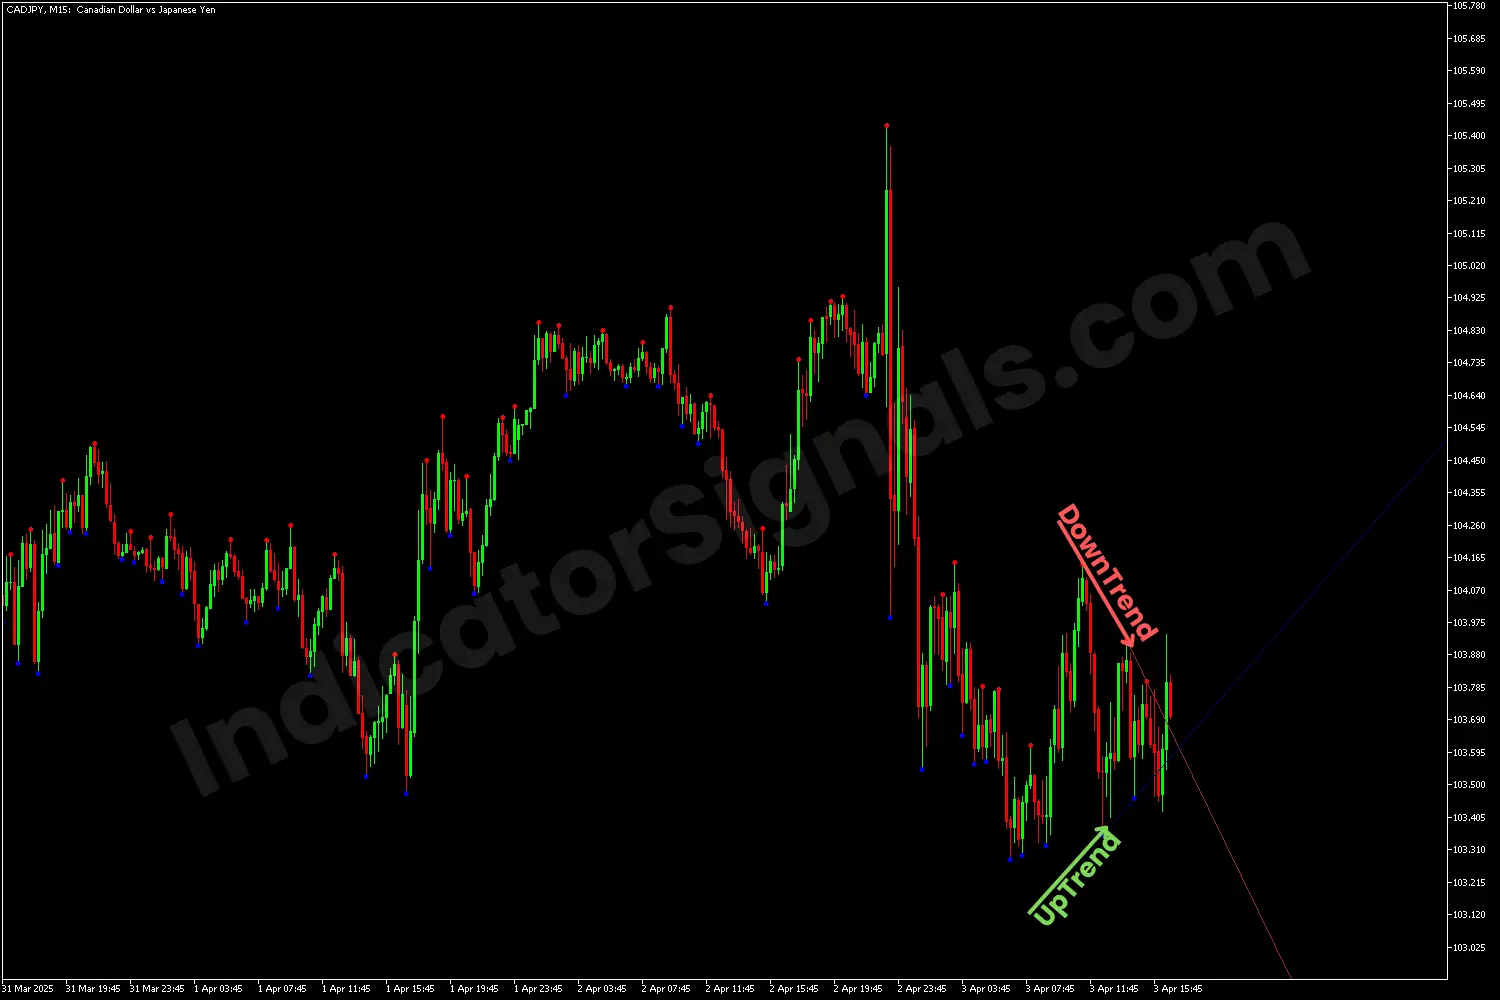
2- For the second trading example on MetaTrader 5, the indicator presents the two lines, up and down, displaying the main trend, which is bullish and a correction trend, which is bearish. Any rebounds from the blue line indicate a buying opportunity and ay bounces off the red line indicates a short signal.
When the price breaks above the trendlineDown, it signals the continuation of the bullish trend, suggesting the exit of the short position and to reenter long on the CADJPY pair.
IndicatorSignals.com - Owned & Operated By
FINANSYA LAB
|
2026 © All Rights Reserved.


