Version:
1.0
Updated:
25 March 2025
Downloads:
0
The Currency Strength Index (CSI) Indicator for MetaTrader 5 is designed to chart the strength momentum of the 8 major currencies (EUR, USD, GBP, JPY, CHF, CAD, NZD, and AUD). It measures the relative strength of different currencies by analyzing price movements across multiple currency pairs. Available on the MT4 platform, the CSI also helps traders identify strong and weak currencies, enabling them to trade in the direction of the strongest trends and spot potential trend reversals by determining market conditions and price divergences.
The Currency Strength Index Indicator is classified as an oscillator, fluctuating around a zero level to evaluate the relative strength or weakness of a currency.
It displays eight distinct lines on the MetaTrader chart, each representing one of the eight major currencies, with each line color-coded for clarity. It uses the percentage difference based on a linear-weighted averaging (LWMA) of the closing prices.
Traders often use the CSI to determine market trends, confirm trade setups, and avoid pairing weak currencies. Moreover, it can highlight potential trend reversals by signaling overbought or oversold market conditions and identifying divergences.
- Identify Strong and Weak Currencies:
- A currency with a high CSI value (above zero) is strong, while one with a negative CSI value is weak. Traders should be looking to pair a strong currency against a weak one to trade in the direction of momentum.
- Confirm Trend Direction:
- For the pair X/Y, if X is consistently strengthening while Y is weakening, it signals a bullish trend. Conversely, it signals a downward trend.
- Ranging markets:
- If two currencies in a pair show similar strength, it indicates a sideways trend.
- Potential reversals:
- Divergence trading: If the price action contradicts the currency strength trend, it may signal a reversal opportunity.
- Market condition: When the CSI values reach extreme levels, which may indicate overbought (extreme positive values) or oversold (extreme negative values) conditions, signaling potential trend reversal.
Once the trader selects the currency pair to analyze and look for trade opportunities, they should disable the display of unrelated currencies in the indicator settings to maintain focus and reduce distractions.
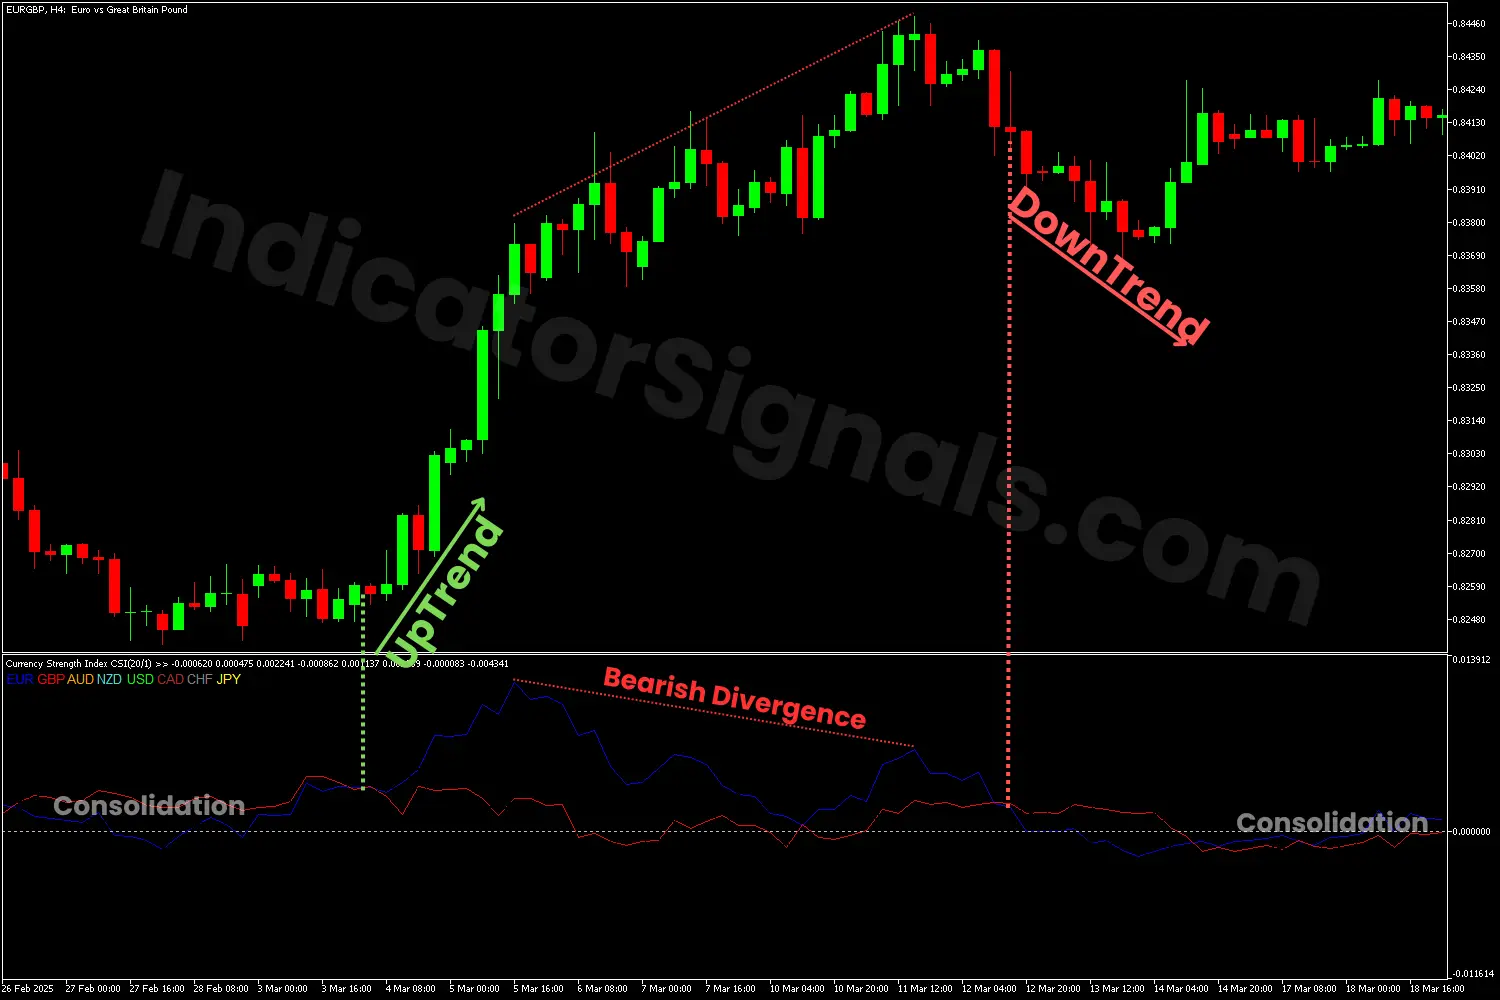
1/ In the EURGBP trading example on the MetaTrader 5 chart, the two CSI lines, the EUR (blue line) and the GBP (red line), oscillate near each other, having the same strength, indicating a sideways trend condition. Once the blue line crosses above the red one, it signals a potential bullish movement.
Toward the trend's end, the price forms higher highs while the indicator shows lower highs for the eur-csi-line, suggesting a potential bearish reversal. When the gbp-csi-line breaks above the blue line, it confirms the beginning of a downward trend and signals a short opportunity.
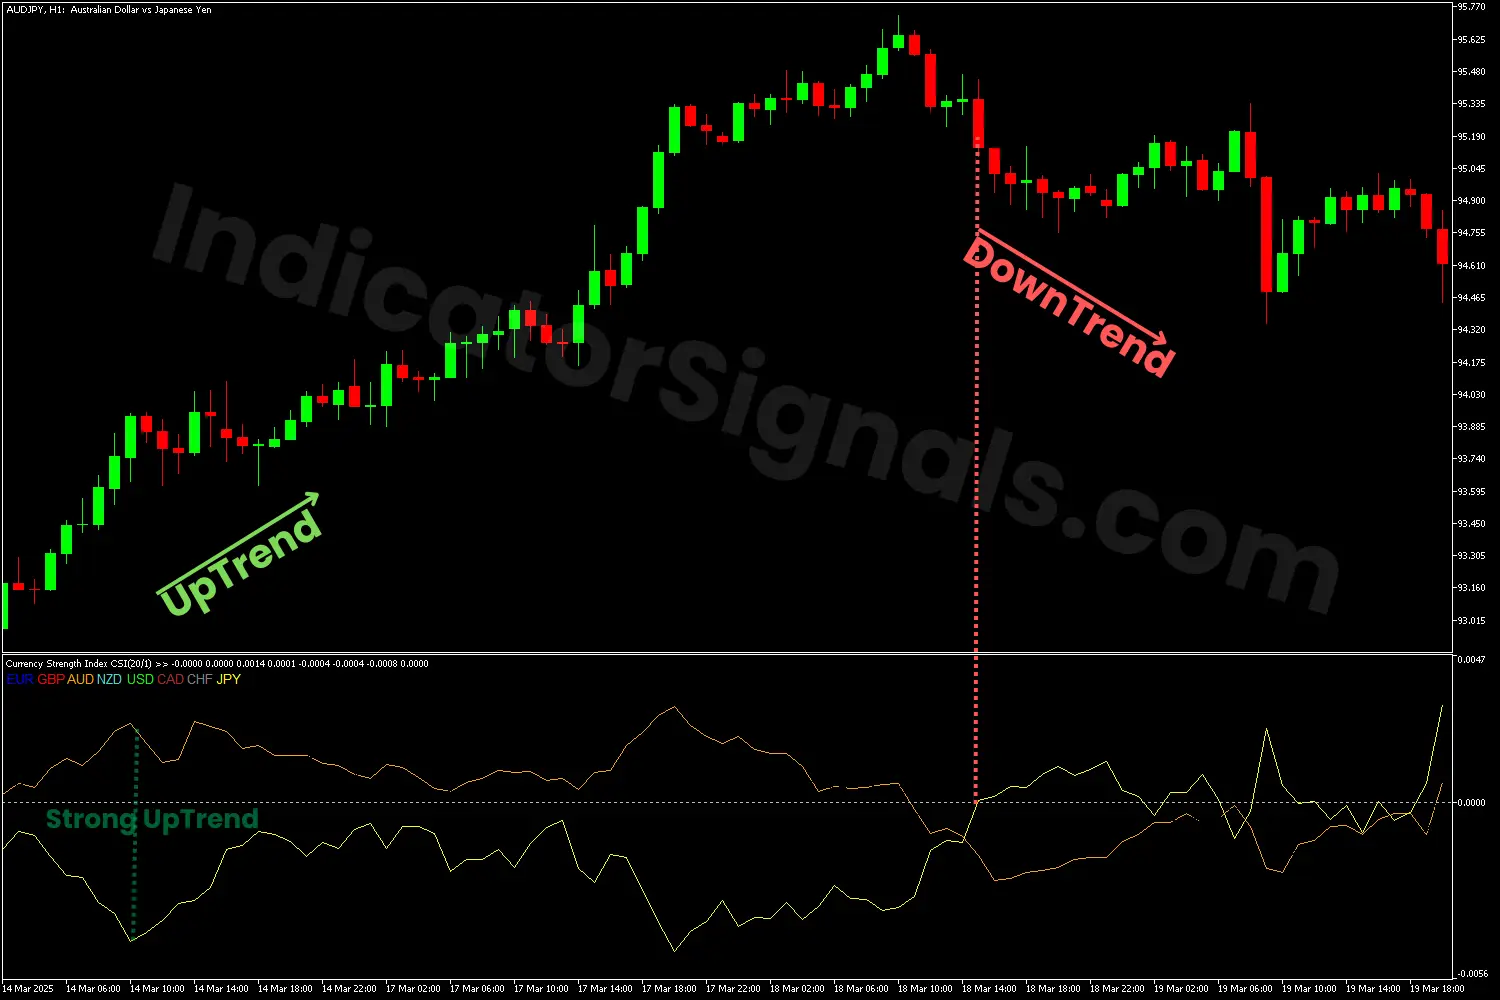
2/ In the AUDJPY trading example on the MetaTrader 4 chart, the aud-csi-line (brown) remains above the zero line and far away from the jpy-csi-line (yellow), which stays below zero, it indicates a strong bullish trend and a long opportunity.
Near the tren's end, the two lines reach two extremes, suggesting overbought and oversold conditions for each currency. When the brown line drops below zero and crosses below the yellow line, it signals a bearish reversal.
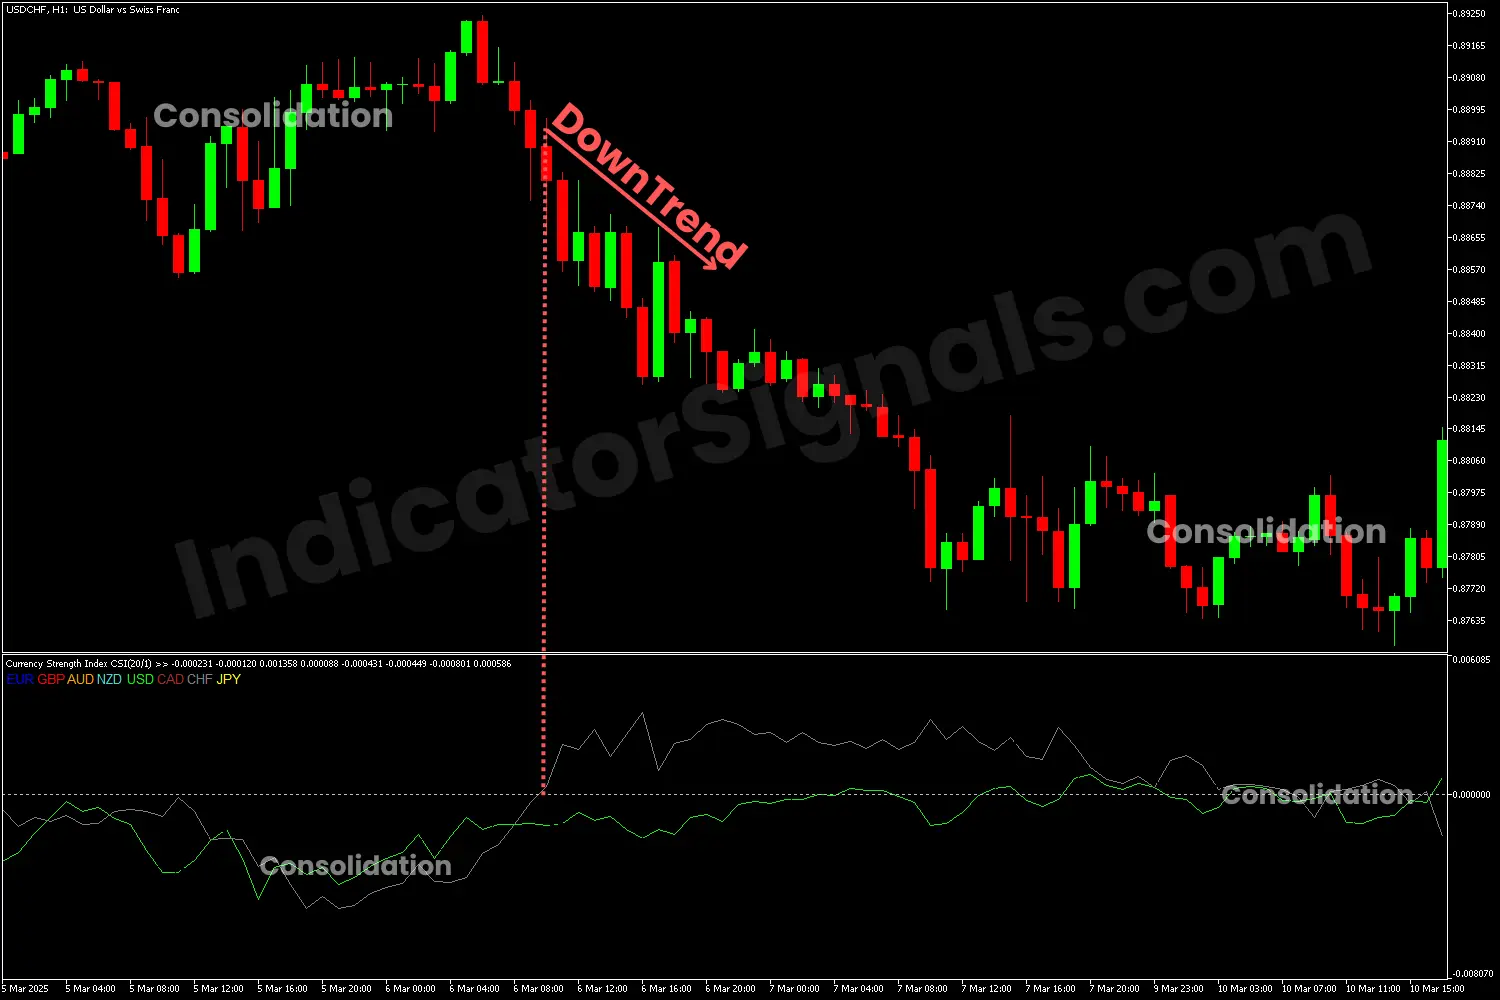
3/ In the USDCHF trading example on the MetaTrader 5 chart, the usd-csi-line (green) and the chf-csi-line (grey) fluctuate near each other, indicating a consolidation phase. When the grey line crosses above the other line and then above the zero line, it suggests a breakout and a beginning of the bearish trend where traders can short the USD against the CHF.
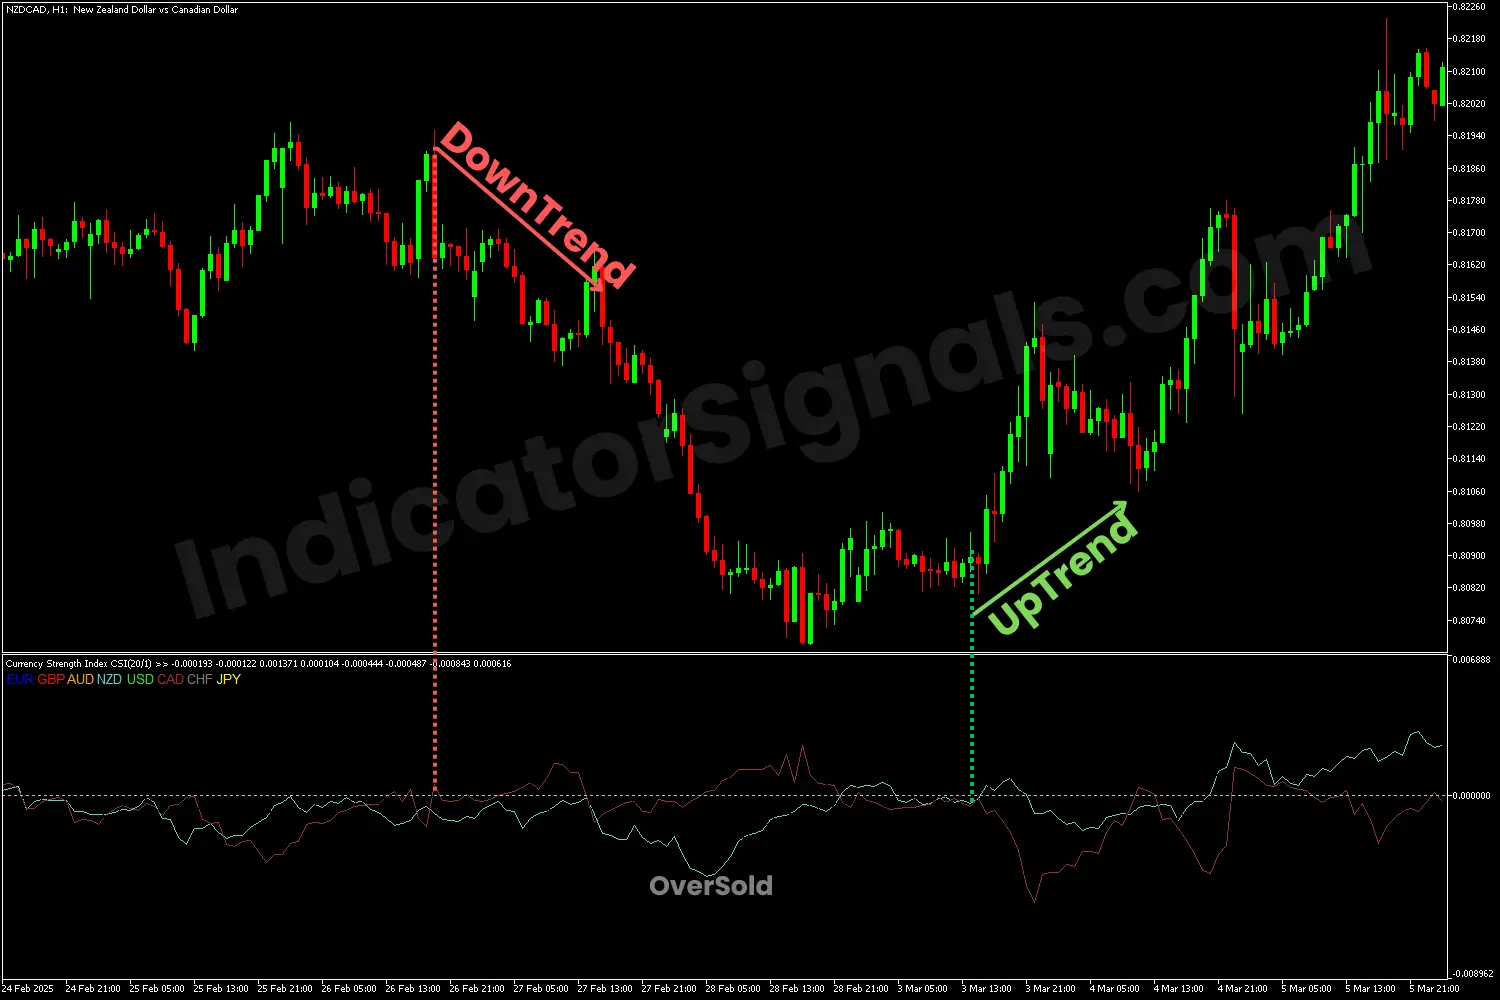
4/ In the NZDCAD trading example on the MetaTrader 4 chart, after a consolidation phase, when the cas-csi-line (dark red) crosses above the nzd-csi-line (light blue) and then above the zero line, it suggests the beginning of a bearish trend. Toward the trend's end, the indicator indicates an oversold condition for the NZD currency, suggesting a potential bullish reversal. Once the two line replace their position, it signals a long opportunity for the NZD against the CAD.
IndicatorSignals.com - Owned & Operated By
FINANSYA LAB
|
2026 © All Rights Reserved.
