Version:
1.0
Updated:
16 May 2025
Downloads:
1
The Correlation Coefficient (CC) for MetaTrader 5 is a statistical indicator that measures the strength and direction of the linear relationship between the current symbol and another specified instrument. Displayed in a separate window as a line plot, the indicator helps traders assess market co-movement, detect asset correlations, and refine multi-asset trading strategies.
The Correlation Coefficient is a quantitative technical indicator designed to compare the price movements of two instruments, typically the current chart symbol and another asset selected by the user. It calculates the Pearson correlation coefficient over a specified lookback period using the applied price (close by default). This indicator returns a value between -1 and +1:
- +1 indicates a perfect positive correlation (assets move in the same direction).
- -1 indicates a perfect negative correlation (assets move in opposite directions).
- 0 suggests no correlation (random price relationship).
The indicator appears as a line in a separate subwindow, with horizontal levels typically set at +1.0, 0.0, and -1.0 for easy reference:
- Positive Correlation (> 0):
- Suggests that both instruments tend to move in the same direction.
- Negative Correlation (< 0):
- Indicates an inverse relationship between the two instruments.
- Near-Zero Correlation:
- Confirms independent movement between the two pairs; their relationship has little or no predictive value.
However, traders often use this indicator to:
- Detect correlation changes over time.
- Avoid overexposure to correlated assets.
- Confirm trade setups in multi-symbol strategies.
Moreover, the CC is often combined with trend indicators, oscillators, or volatility filters for best results. It's especially valuable for traders analyzing cross-currency pairs, commodities versus indices, or stocks with shared macroeconomic drivers.
To help traders understand how to use the Correlation Coefficient (CC) indicator effectively and take advantage of profitable setups, here’s a practical example:
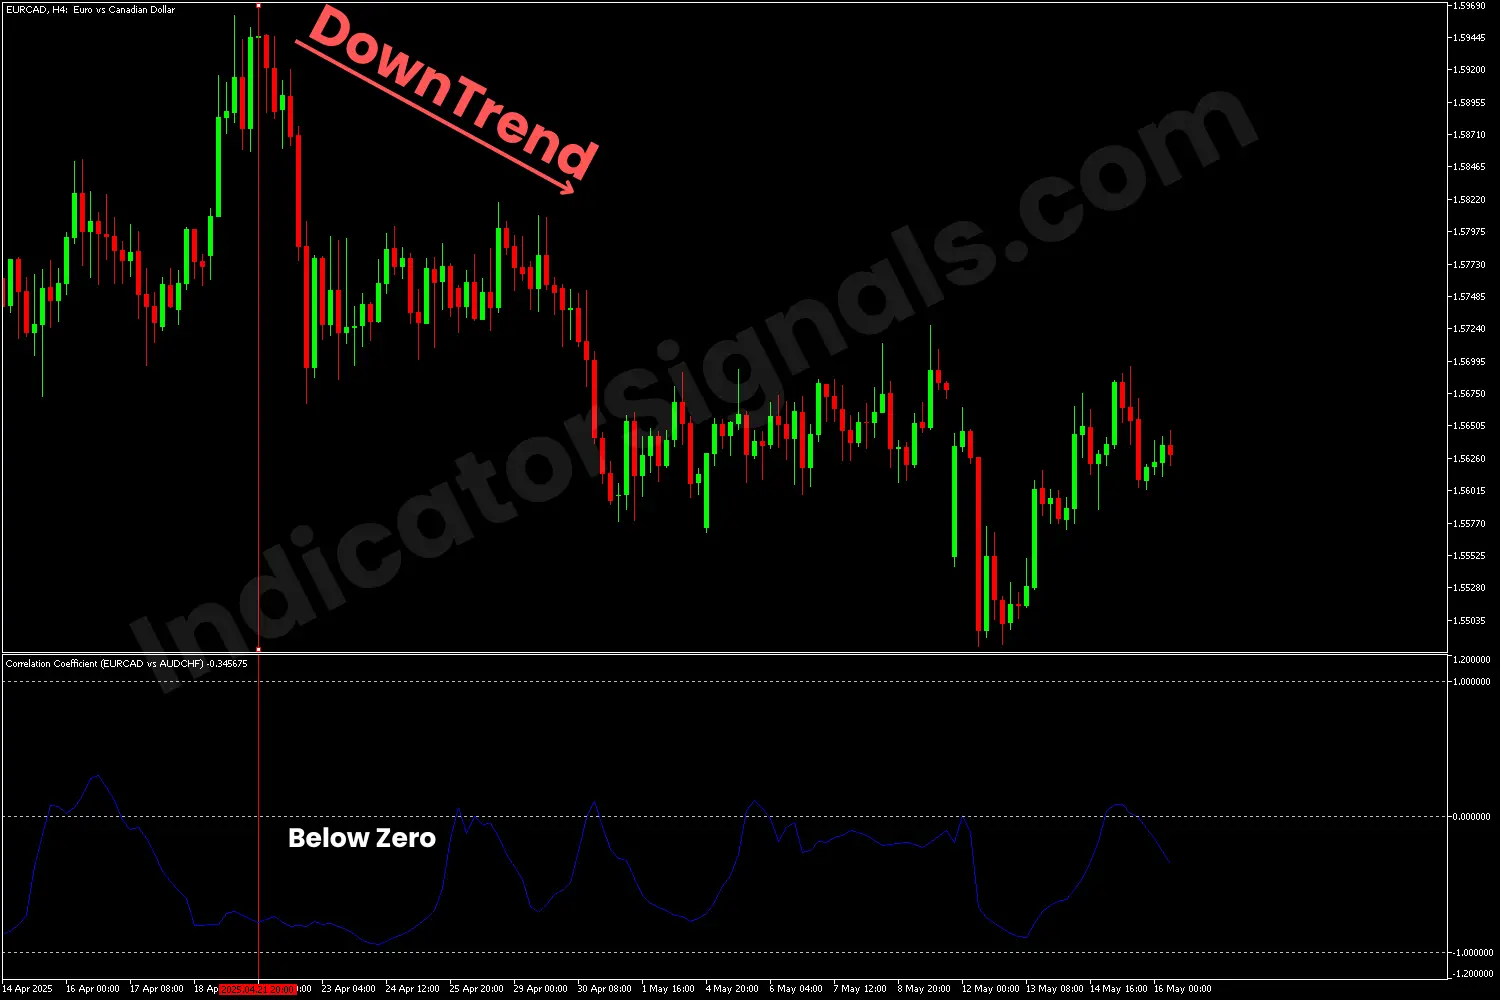
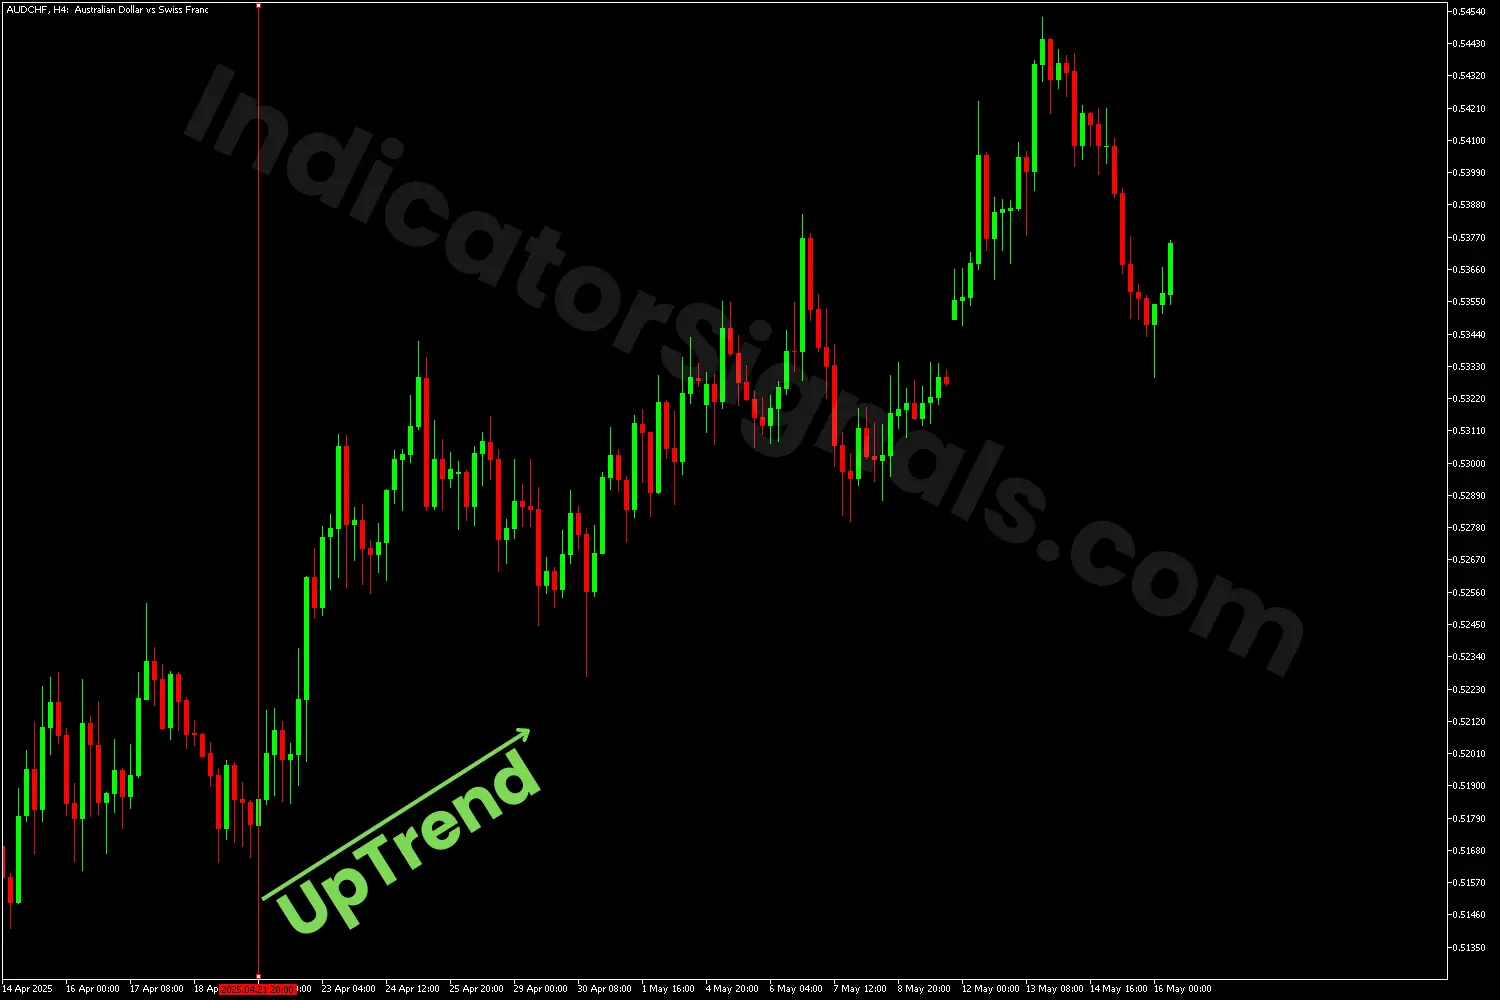
1- In the first example, I applied the CC indicator to the EURCAD chart and used AUDCHF as the reference pair. Traders can choose any pair they prefer as the base for comparison. In this case, the AUDCHF showed a clear uptrend, which made it a reliable reference to assess market sentiment.
However, the CC indicator displayed negative values (below the zero line), indicating a negative correlation between the two pairs. This suggested that while AUDCHF was moving upward, EURCAD was likely to move in the opposite direction, downward. This signaled a potential short opportunity on EURCAD, which played out correctly, as confirmed by the market movement in the chart example.
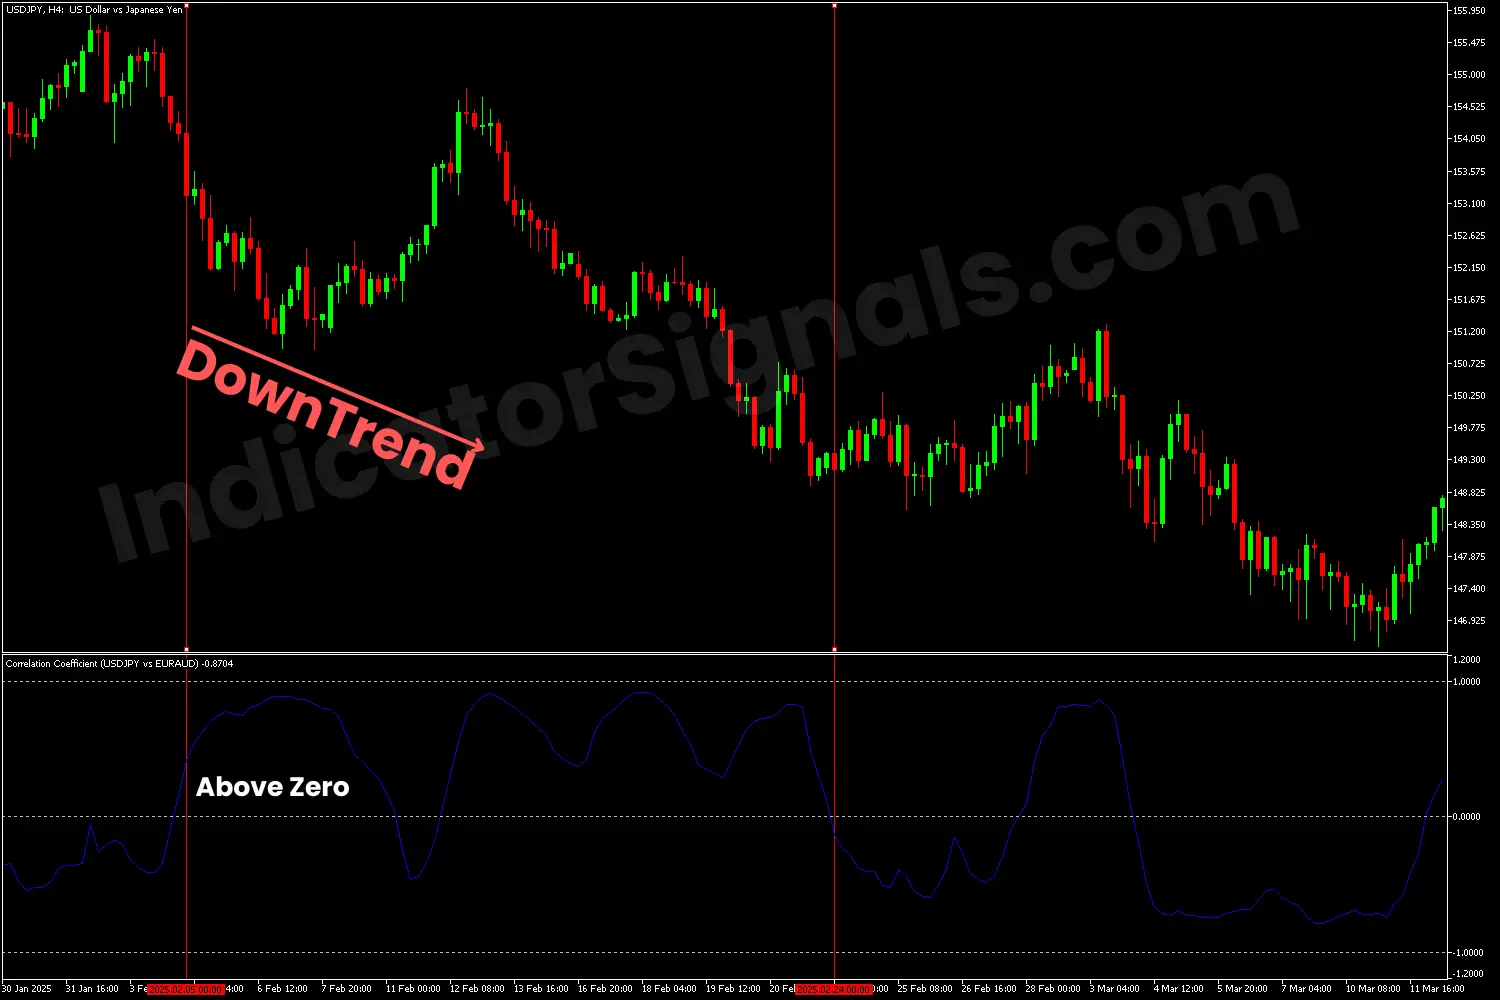
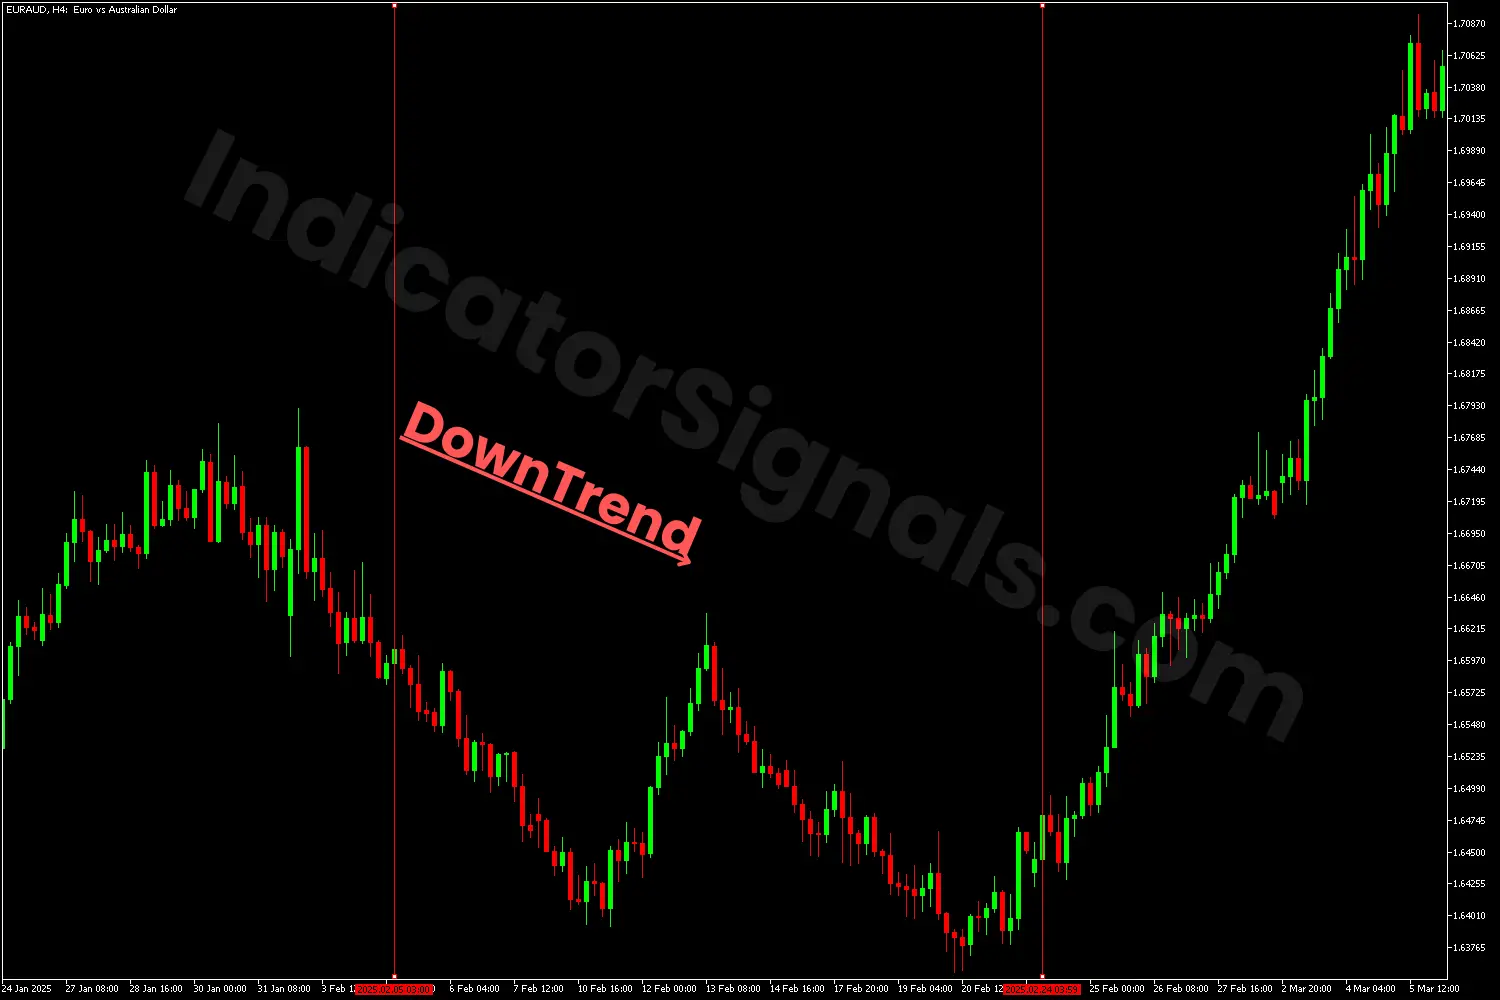
2- In the second example, I implemented the CC indicator to the USDJPY chart and used EURAUD as the reference pair. In this case, the EURAUD showed a clear downward trend, which made it a reliable reference to analyze market sentiment.
Moreover, the CC indicator displayed positive values (above the zero line), indicating a positive correlation between the two pairs. This suggested that while EURAUD was moving downward, USDJPY was likely to move in the same direction, bearish. This signaled a potential selling opportunity on USDJPY, which played out correctly, as confirmed by the market movement in the chart example.
IndicatorSignals.com - Owned & Operated By
FINANSYA LAB
|
2026 © All Rights Reserved.
