Version:
1.0
Updated:
02 June 2025
Downloads:
0
The Constant Range Channel (CRC) on MetaTrader 4 maintains a fixed width between the two bands of the channel, unlike the Bollinger Bands and the Keltner Channel indicators, which adjust to volatility. This allows traders to identify trends, breakouts, and potential reversals within a predefined price range. Also available on MT5, this indicator is more effective in ranging and breakout trading strategies.
The Constant Range Channel is a channel-based indicator. Unlike traditional channel indicators such as Bollinger Bands or Keltner Channels, which automatically expand or contract based on market volatility, the CRC maintains a fixed, predefined distance between its upper and lower bands. This unique feature ensures that the channel width remains constant, regardless of changing volatility conditions. As a result, the CRC provides a stable framework for identifying dynamic support and resistance levels, spotting potential breakout zones, and enhancing price structure analysis.
Moreover, the indicator consists of three main components:
- Upper Band (Blue Line): Acts as a dynamic resistance level.
- Lower Band (Red Line): Serves as a dynamic support level.
- Middle Line (Yellow Line): Helps to define the directional bias and trading strategy.
To maximize trading effectiveness using the CRC, traders can adopt one of the following approaches based on the slope of the middle line:
- Range Trading Strategy: When the middle line is flat or nearly horizontal.
In sideways markets, the CRC helps identify clear entry and exit points within a defined range.
- Sell near the Upper Band (Blue Line): A price approaching this level may indicate overbought conditions, offering a potential short or sell setup.
- Buy near the Lower Band (Red Line): A price nearing this support area suggests potential long or buy setups, especially if accompanied by reversal signals.
- Breakout Trading Strategy: When the middle line trends upward or downward.
When the CRC’s yellow centerline shows a clear slope, it indicates a directional trend. In such cases, traders can look for breakout opportunities beyond the predefined range.
- Breakout above the Upper Band: A strong bullish breakout signals a potential continuation of an uptrend. This is typically a cue to enter long positions.
- Breakout below the Lower Band: A strong bearish breakout may suggest the start or continuation of a downtrend, signaling shorting opportunities.
To sum up, it is highly recommended, especially during range trading, to combine the CRC with other technical analysis indicators to avoid false signals and to confirm trade decisions before entering the market.
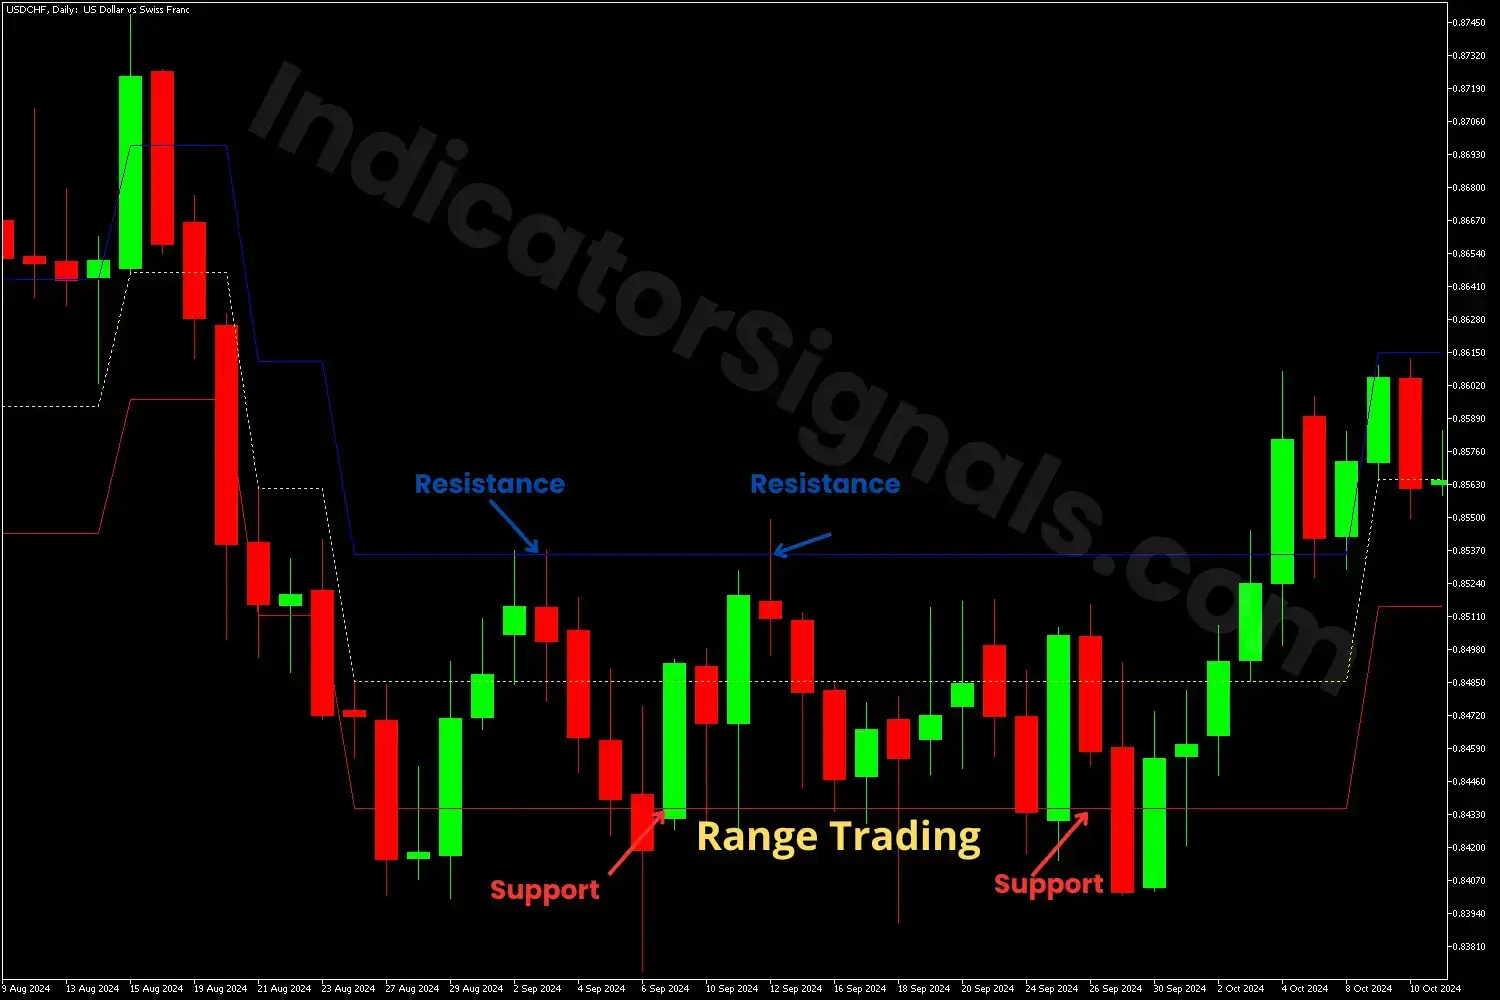
1/ In the USDCHF Daily chart example on MT4, the price was trading within a horizontal range. However, the CRC indicator highlighted the boundaries of this range, suggesting when the price approached the upper band (blue line), which acted as a resistance zone, it signaled a potential selling opportunity. Conversely, when the price fell toward the lower band (red line), functioning as support, it indicated a buying opportunity.
The market reacted accordingly to these zones, validating the indicator’s effectiveness in a ranging environment. Traders following the CRC were able to enter positions with confidence, capitalizing on these consistent bounces between support and resistance.
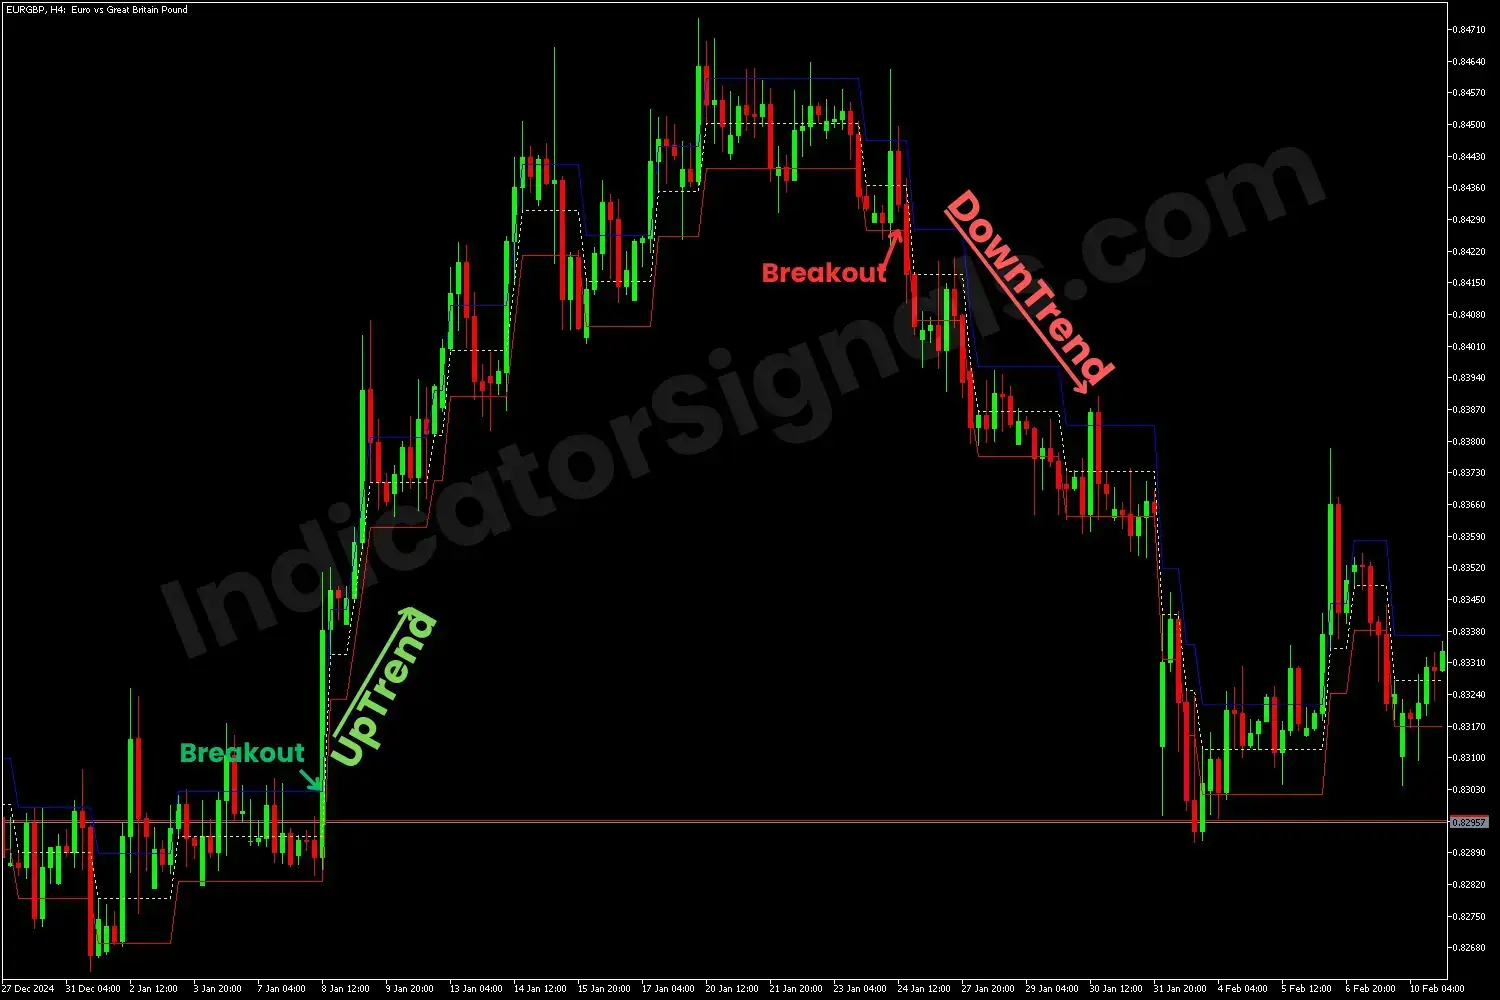
2/ In the EURGBP H4 chart example on MT5, the price breaks above the upper band of the CRC. This breakout confirmed bullish momentum and marked the beginning of a strong uptrend.
As the trend matured and the market entered a consolidation phase, the price eventually broke below the lower band, signaling a trend reversal. This breakout to the downside suggested that traders should close long positions and consider shorting the pair, anticipating a new bearish phase.
To highlight, the CRC indicator can help traders detect both trend continuation and reversal opportunities, especially when price action interacts decisively with the channel boundaries.
IndicatorSignals.com - Owned & Operated By
FINANSYA LAB
|
2026 © All Rights Reserved.


