Version:
1.0
Updated:
10 April 2025
Downloads:
0
The Chande Kroll Stop (CKS) for MetaTader 5 is a volatility-based trailing stop indicator that displays two lines, one for long positions and one for short trades, based on the Average True Range (ATR) and recent highs and lows. Also available on the MT4 platform, the CKS helps traders identify potential stop-loss levels and trend reversals, making informed trade decisions and managing their risk reward ratio more accurately.
The Chande Kroll Stop, developed by Tiushar Chande and Stanley Kroll, is a trend-following indicator that sets flexible stop levels based on market volatility. It uses the ATR to calculate two lines:
- Stop Long Line (Blue): Plotted below price, based on the lowest low over a period, plus a multiple of ATR.
- Stop Short Line (Red): Plotted above price, based on the highest high over a period, minus a multiple of ATR.
Furthermore, this indicator is often used in trending markets with high volatility. It helps traders identify trend direction, determine exit points, and avoid premature stop-outs due to noise.
- Trend Identification:
- Long trades: When the price moves above the SL and SS lines, it signals an upward trend. Traders could enter long when the price closes above the red line.
- Short trades: When the price falls below the two lines, it suggests a bearish trend. Traders may consider entering short when the price closes below the blue line.
- Potential reversal:
- If the price closes below the SL line, it signals a potential bearish reversal. Traders should exit their buying trades.
- If the price closes above the SS line, it indicates a potential bullish reversal. Traders should exit their selling trades.
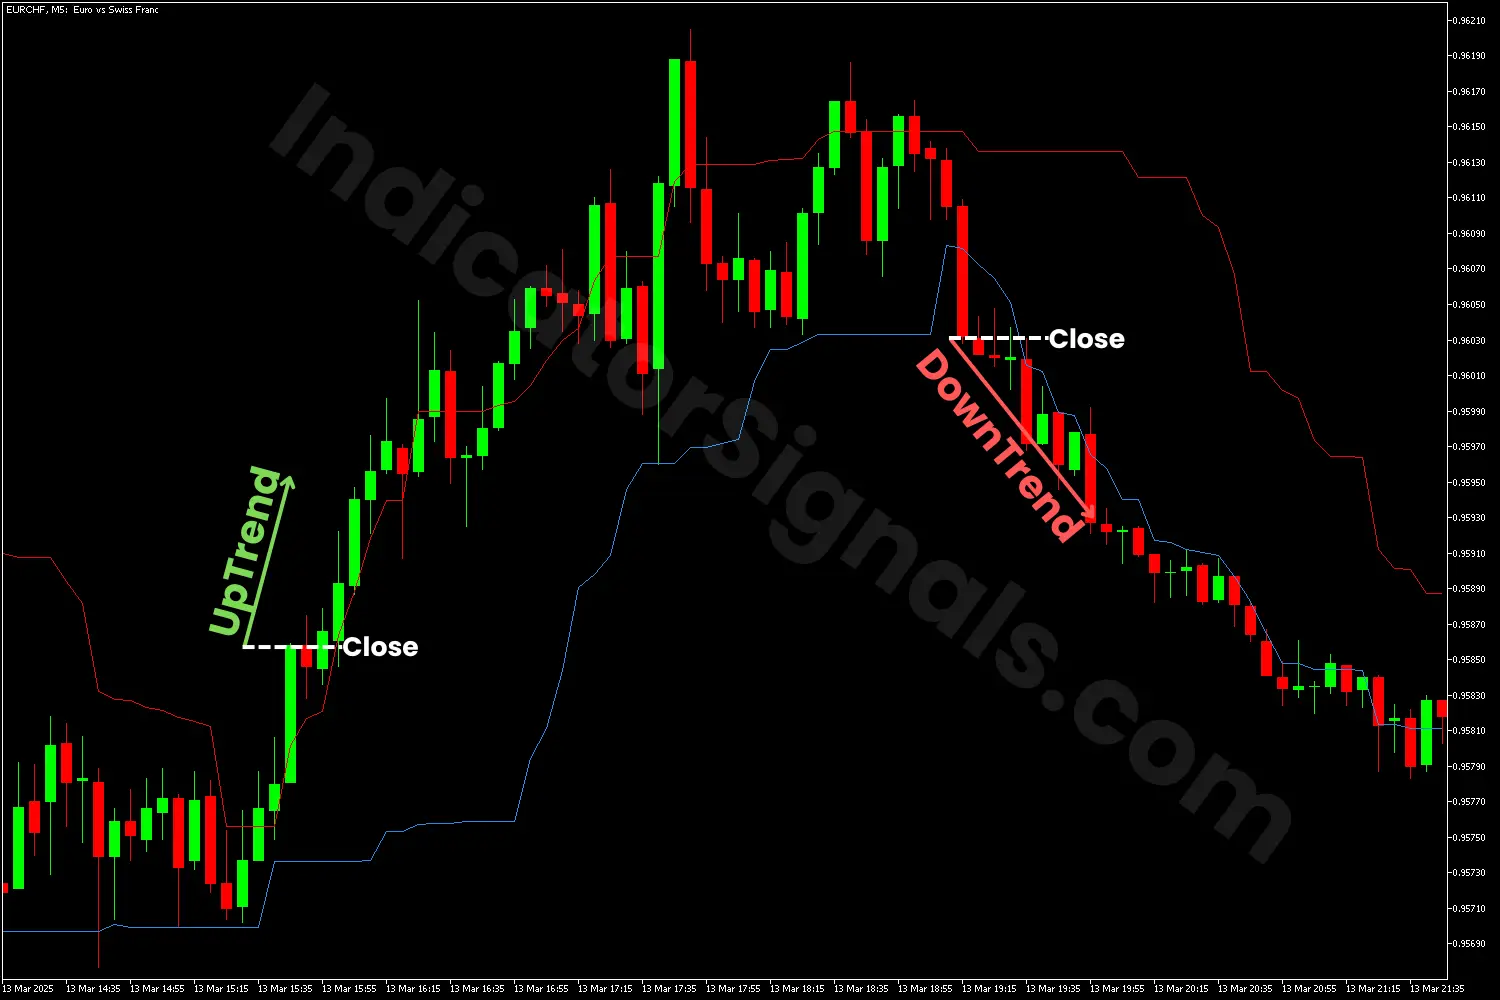
1/ In the first trading example on the MetaTrader 4 chart, when the price rises above the SL and SS lines and then closes above the red line, it signals a potential bullish trend. Traders should enter long on the EURCHF pair, setting their stop-loss price below the blue line.
Toward the trend's end, when the price falls below both lines and closes below the SL line, it indicates a potential bearish reversal, and traders should exit their long positions and enter selling in the market.
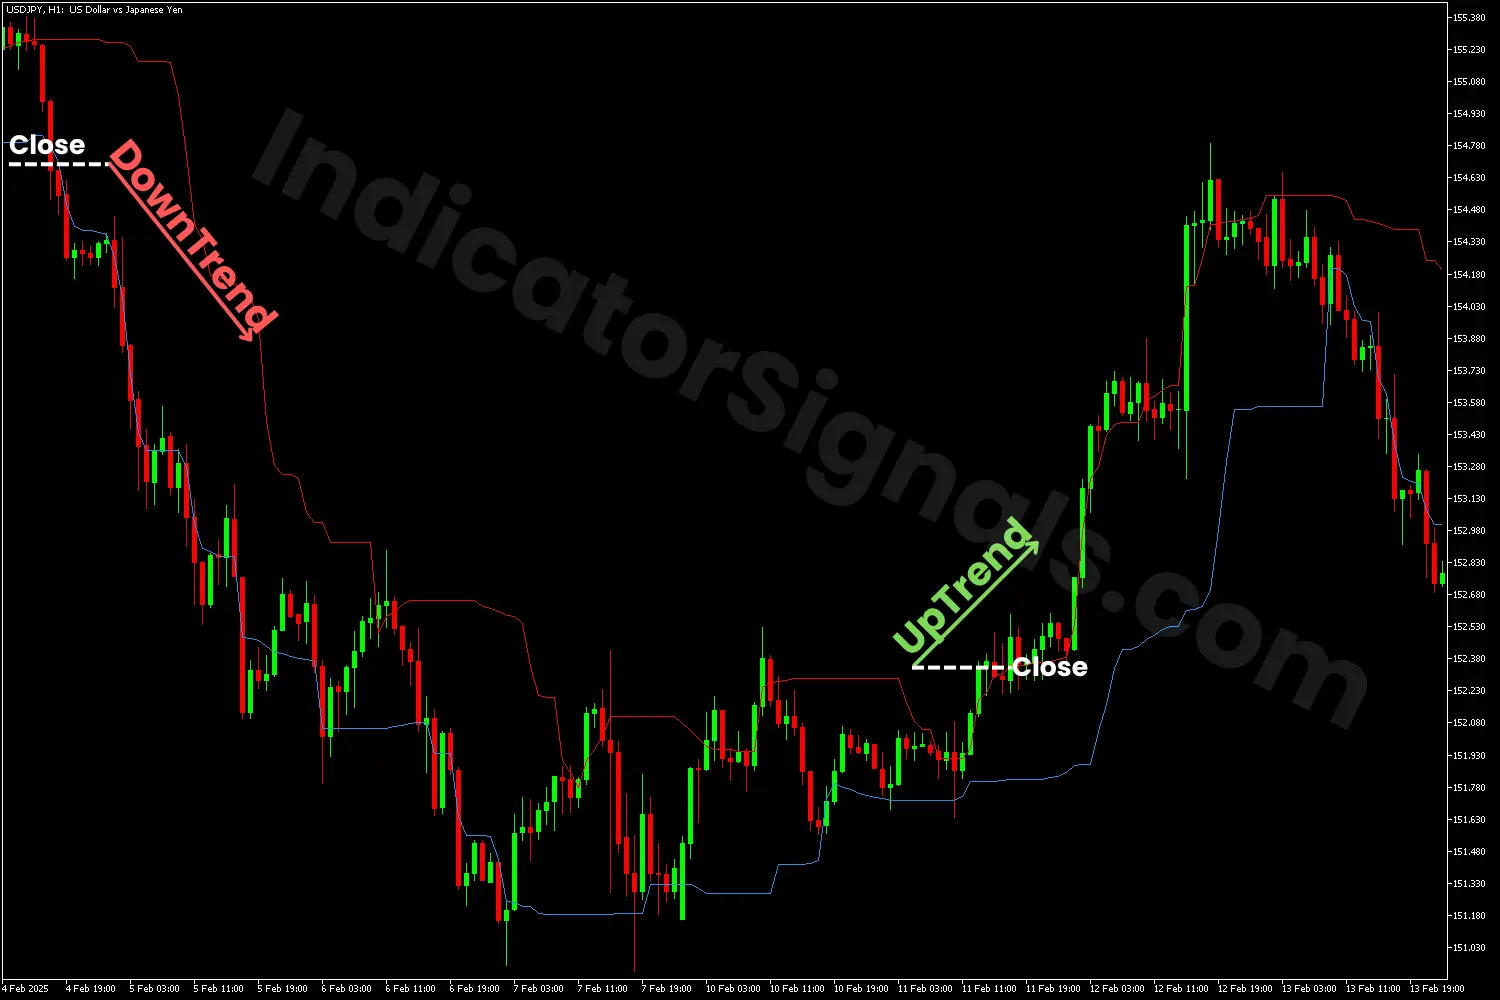
2/ In the second trading example on the MetaTrader 5 chart, when the price drops below the SS and SL lines and then closes below the blue line, it signals a potential bearish trend. Traders should enter short on the USDJPY pair, setting their stop-loss price above the red line.
Near the trend's end, when the price rises above both lines and closes above the SS line, it indicates a potential bullish reversal. In this scenario, traders should wait for a second significant bullish candle to exit their short trades and enter buying in the market.
IndicatorSignals.com - Owned & Operated By
FINANSYA LAB
|
2026 © All Rights Reserved.


