Version:
1.0
Updated:
02 June 2025
Downloads:
1
The Chaikin Oscillator Smoothed (CHO Smoothed) Indicator on MT4 is designed to measure the momentum of the Accumulation/Distribution Line (ADL) by incorporating smoothing techniques to reduce price noises. Available on MetaTrader 5 as well, this indicator helps trades identify potential trend reversals and determine market direction, signaling optimal entry and exit points.
The Chaikin Oscillator Smoothed (CHO Smoothed) is an enhanced version of the traditional Chaikin Oscillator (CHO), designed to offer improved trend detection and reduce the frequency of false signals. While the original CHO is calculated by subtracting a longer-period EMA from a shorter-period EMA of the Accumulation/Distribution Line (ADL), the smoothed version adds a layer of filtering, typically using a Weighted Moving Average (WMA) or an Exponential Moving Average (EMA)—applied directly to the raw CHO output:
- CHO Smoothed = EMA/WMA (CHO, smoothing period)
This additional smoothing helps traders eliminate market noise and better identify true shifts in momentum, especially in volatile or choppy market conditions.
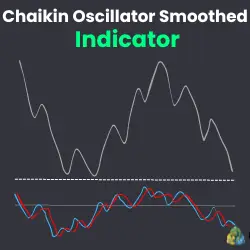
When applied to a chart, the CHO Smoothed indicator displays two distinct lines:
- Blue Line: Represents the original CHO (unsmoothed), capturing raw momentum based on volume and price action.
- Red Line: Represents the smoothed version of the CHO, offering a clearer view of the underlying trend direction and reducing short-term fluctuations.
These two lines can be used for various interpretations and trading strategies:
1. Trend Reversal Signals (Divergence Analysis):
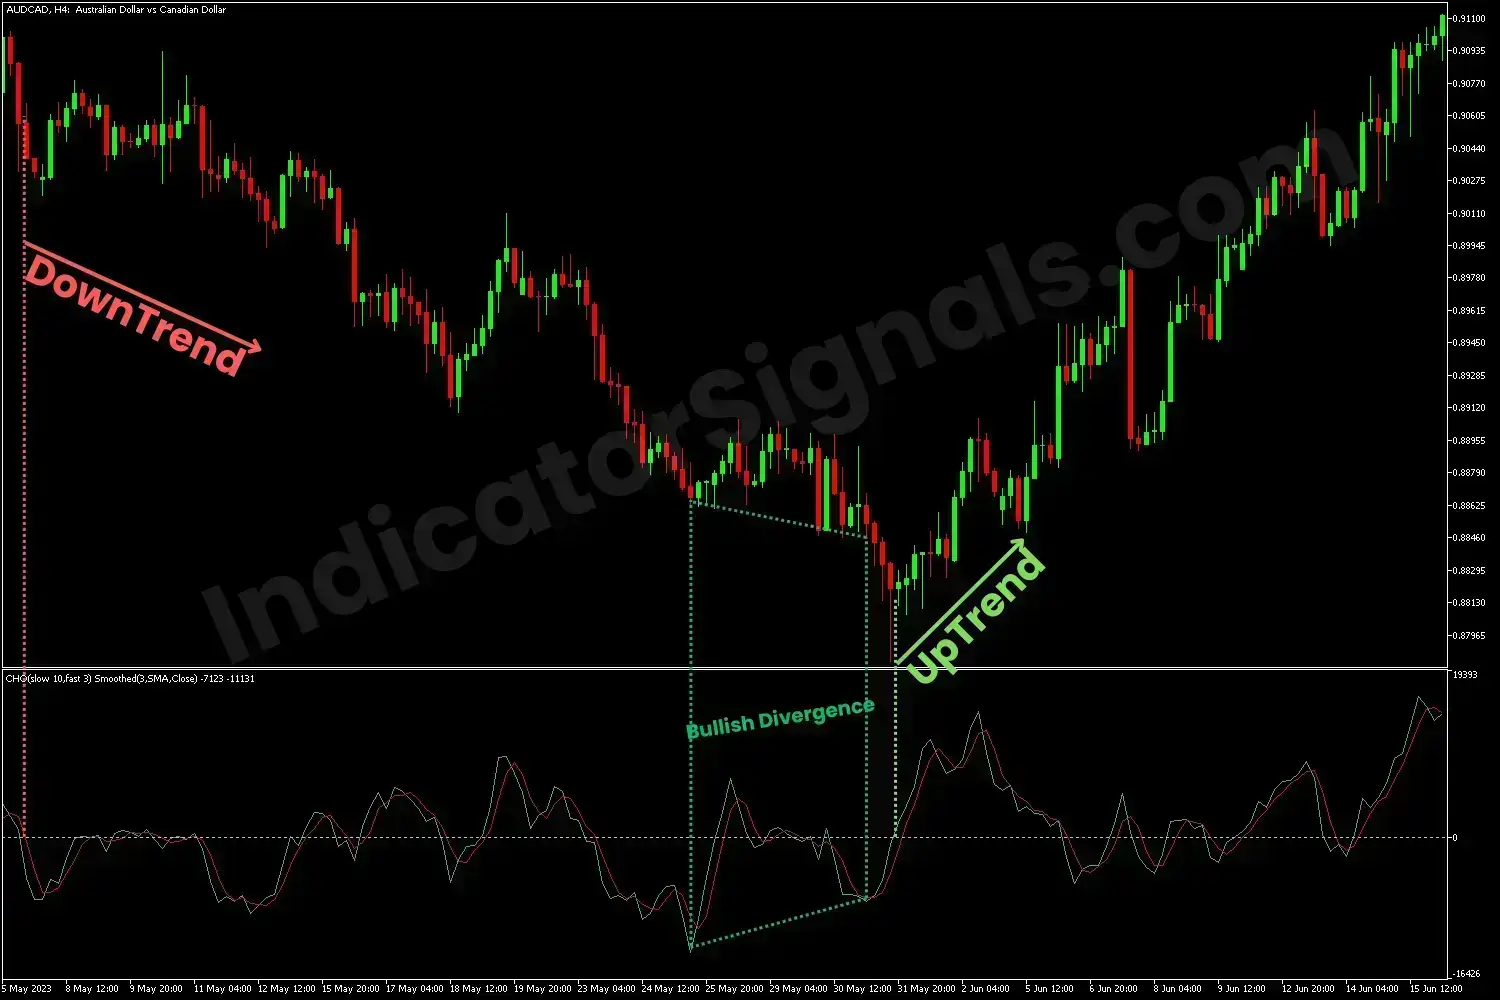
- Bullish Divergence: When the price forms lower lows, but the CHO (blue line) shows higher lows, it indicates weakening bearish pressure and a potential shift to bullish momentum. This divergence can act as a signal to prepare for a possible long entry.
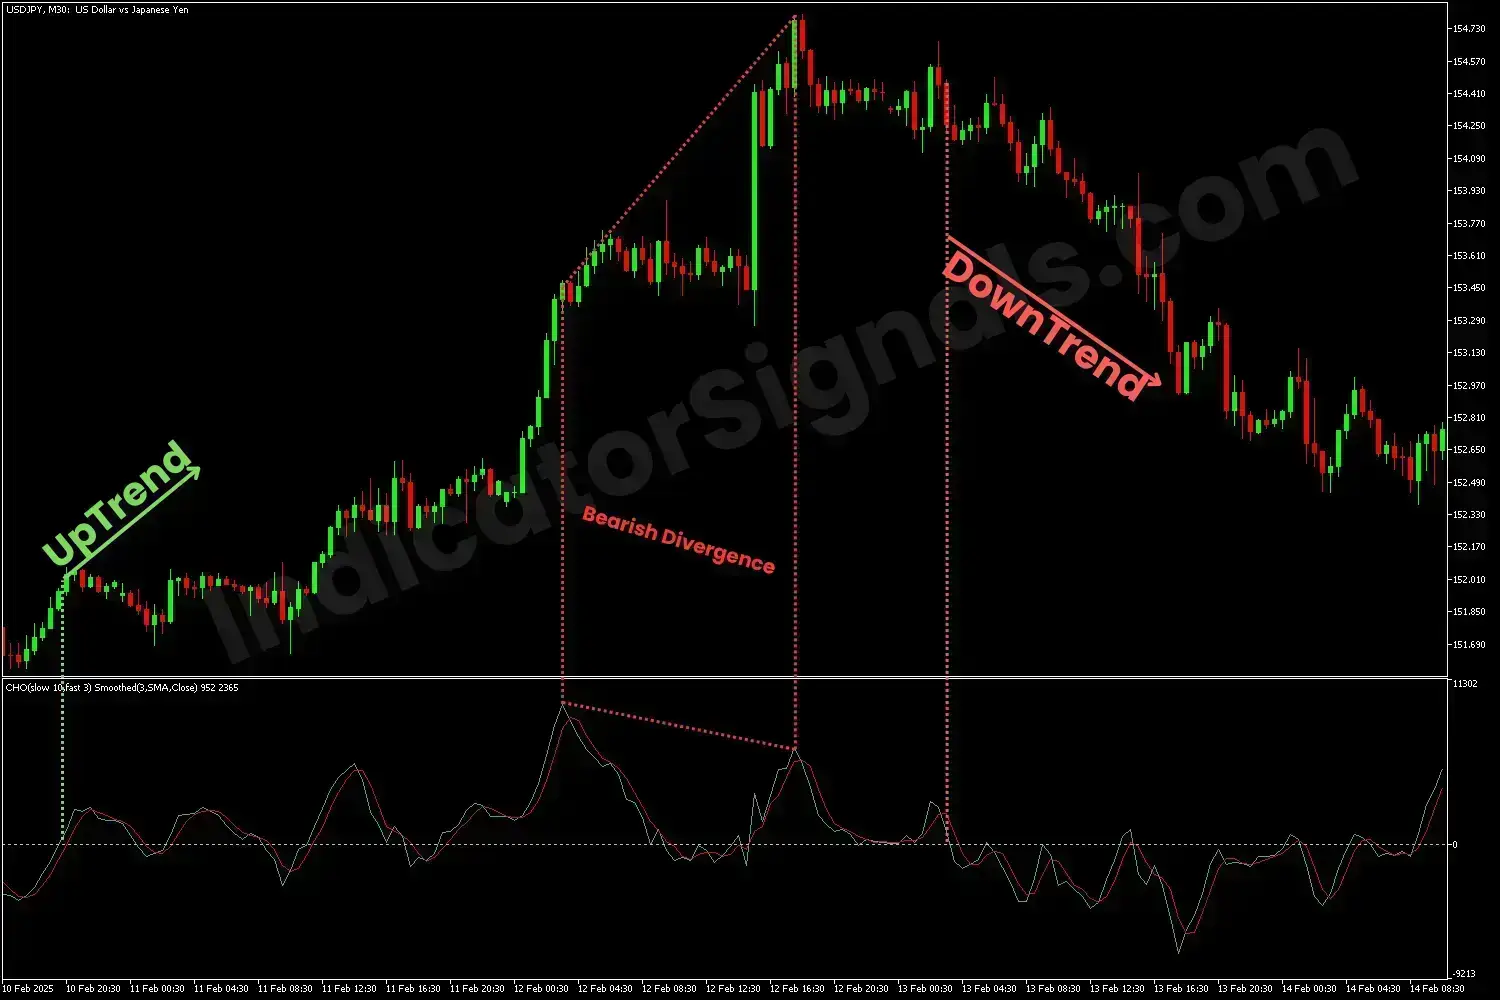
- Bearish Divergence: When the price prints higher highs while the CHO forms lower highs, it reflects a loss of bullish strength, potentially signaling the beginning of a bearish reversal.
2. Trend Direction and Momentum Strength:
- A bullish signal occurs when the blue CHO line crosses above the red smoothed line and then moves above the zero level (balanced line). This indicates a strengthening upward trend and a potential long-trade opportunity.
- A bearish signal is triggered when the CHO crosses below the smoothed line and continues above the zero line. This suggests growing bearish momentum and may signal a short opportunity.
When combined with other categories of technical analysis indicators, such as trend-following, volume, or patterns, the Chaikin Oscillator Smoothed can enhance trading accuracy to traders.
1/ In the USDJPY trading example on the MT4 chart, a bullish signal is generated when the CHO (blue line) crosses above its smoothed red line, followed by a subsequent crossover above the zero line (balanced line). This sequence indicates the start of an upward trend. During such bullish conditions, traders are encouraged to focus exclusively on long positions. In this context, any downward crossover of the CHO below the zero level may act as a signal to exit existing long trades, with a new crossover above the zero line reinforcing a strong buying opportunity.
As the trend progresses, signs of exhaustion appear when the price forms higher highs but the CHO oscillator fails to confirm, forming lower highs instead. This bearish divergence serves as a key warning of a potential reversal. Once the CHO drops below the balance line, the bearish scenario is confirmed, providing a clear sell signal or an early indication to prepare for a short entry.
2/ In the AUDCAD trading example on the MT5 chart, a bearish signal is triggered when the CHO line (blue) crosses below the smoothed line (red), and then breaks below the zero level, confirming a shift into a downtrend. It's important to note that market movements consist of impulses and corrections, and during a bearish phase, traders should prioritize short entries. A brief crossover above the balance line may suggest a potential exit point for those holding short positions, with a continued movement below the line reinforcing the dominance of bearish momentum and presenting a new selling opportunity.
As the trend nears its conclusion, the price action may form lower lows, but if the CHO begins to print higher lows, this forms a bullish divergence, which suggests weakening bearish momentum. When the CHO line subsequently crosses above the zero level, it confirms a bullish reversal, signaling an ideal time to enter a long position or to prepare for a shift in market direction.
IndicatorSignals.com - Owned & Operated By
FINANSYA LAB
|
2026 © All Rights Reserved.


