Version:
1.0
Updated:
25 February 2025
Downloads:
1
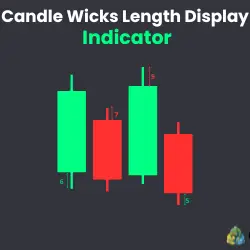
The Candle Wicks Length Display (CWLD) Indicator on MetaTrader 4 is a technical indicator that helps analysts visualize the length of upper and lower wicks for each candle. By applying this indicator on MT5 also, traders can analyze market volatility, bullish/bearish rejection, and potential reversals, aiding them make informed trading decisions and identify entry and exit points.
The CWLD Indicator is classified as a patterns indicator, offering traders insights into the market sentiment based on shadow lengths. By displaying the bullish and bearish wick sizes directly on the chart, traders can identify whether the market is controlled by buyers or sellers.
To understand how this indicator works, here below how it can be analyzed:
- Confirm Trend Strength or Weakness:
- Short wicks indicate a strong trend with little rejection.
- Long wicks signal possible reversal as the trend weakens.
- Identify Price Rejections & Reversals:
- A long upper wick indicates that sellers are in control (bearish rejection).
- A long lower wick signifies buyer dominance (bullish rejection).
Furthermore, this indicator provides real-time visual information into price movements, enhancing decision-making, and adapting to any trading strategies.
In this section, I will explain, through two trading examples, how the candle wicks length indicator can provide clear and very objective insights for traders.
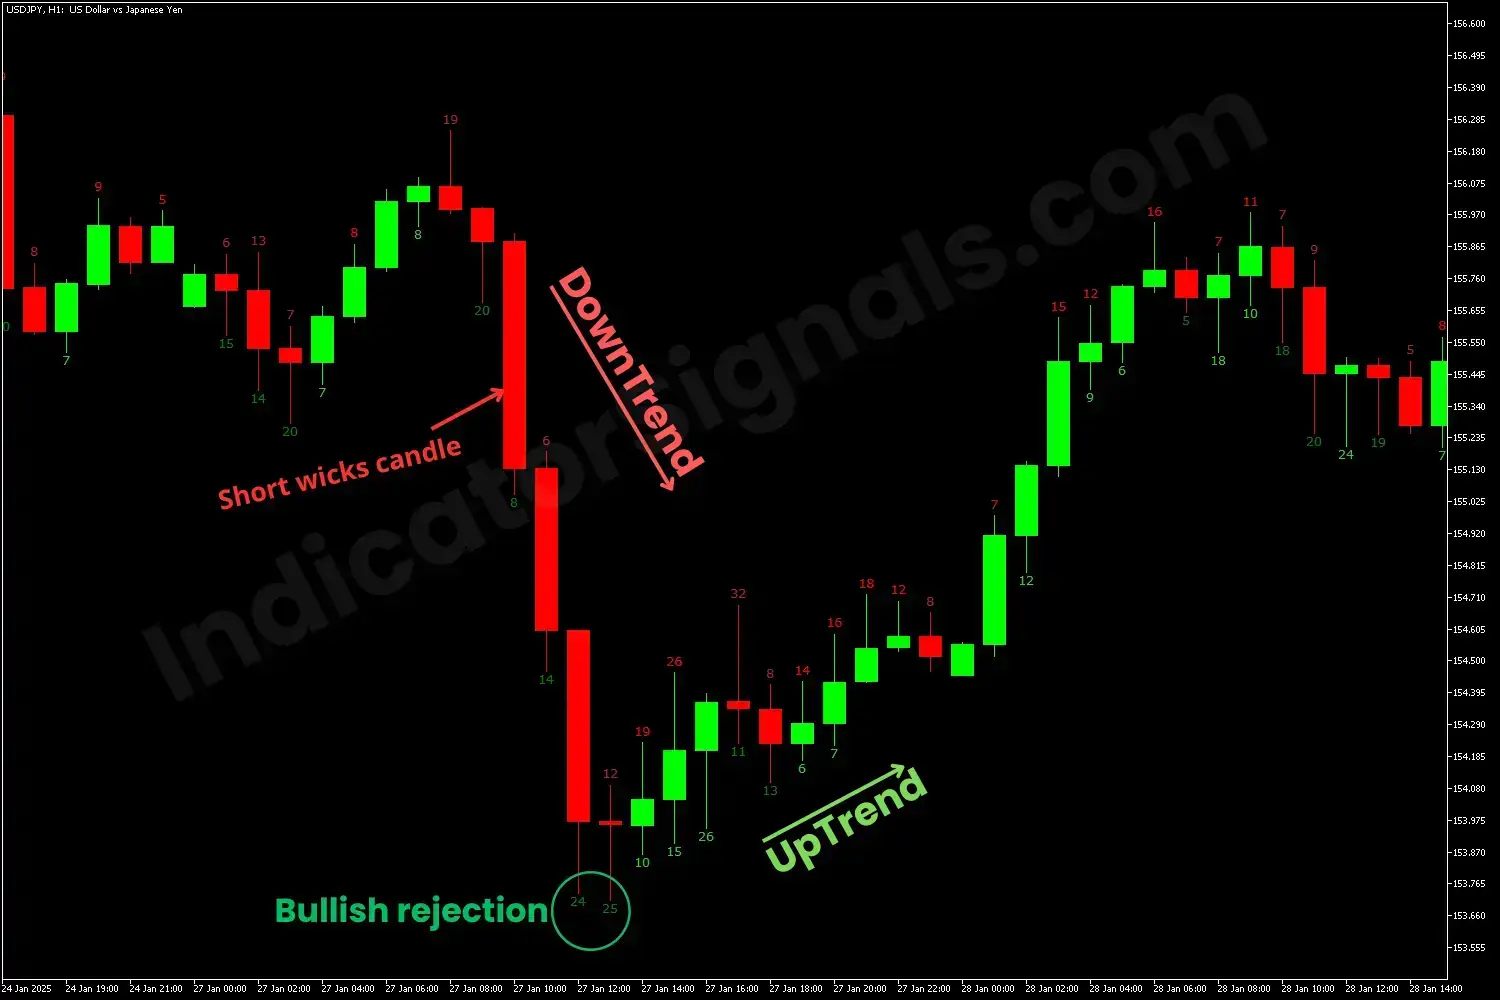
In the USDJPY chart on MT4, during a downtrend, a significant red candle with short wicks appears, confirming the continuation of the downward movement. Near the trend's end, two candles with long lower wicks emerge, signaling bullish rejection and a potential trend reversal.
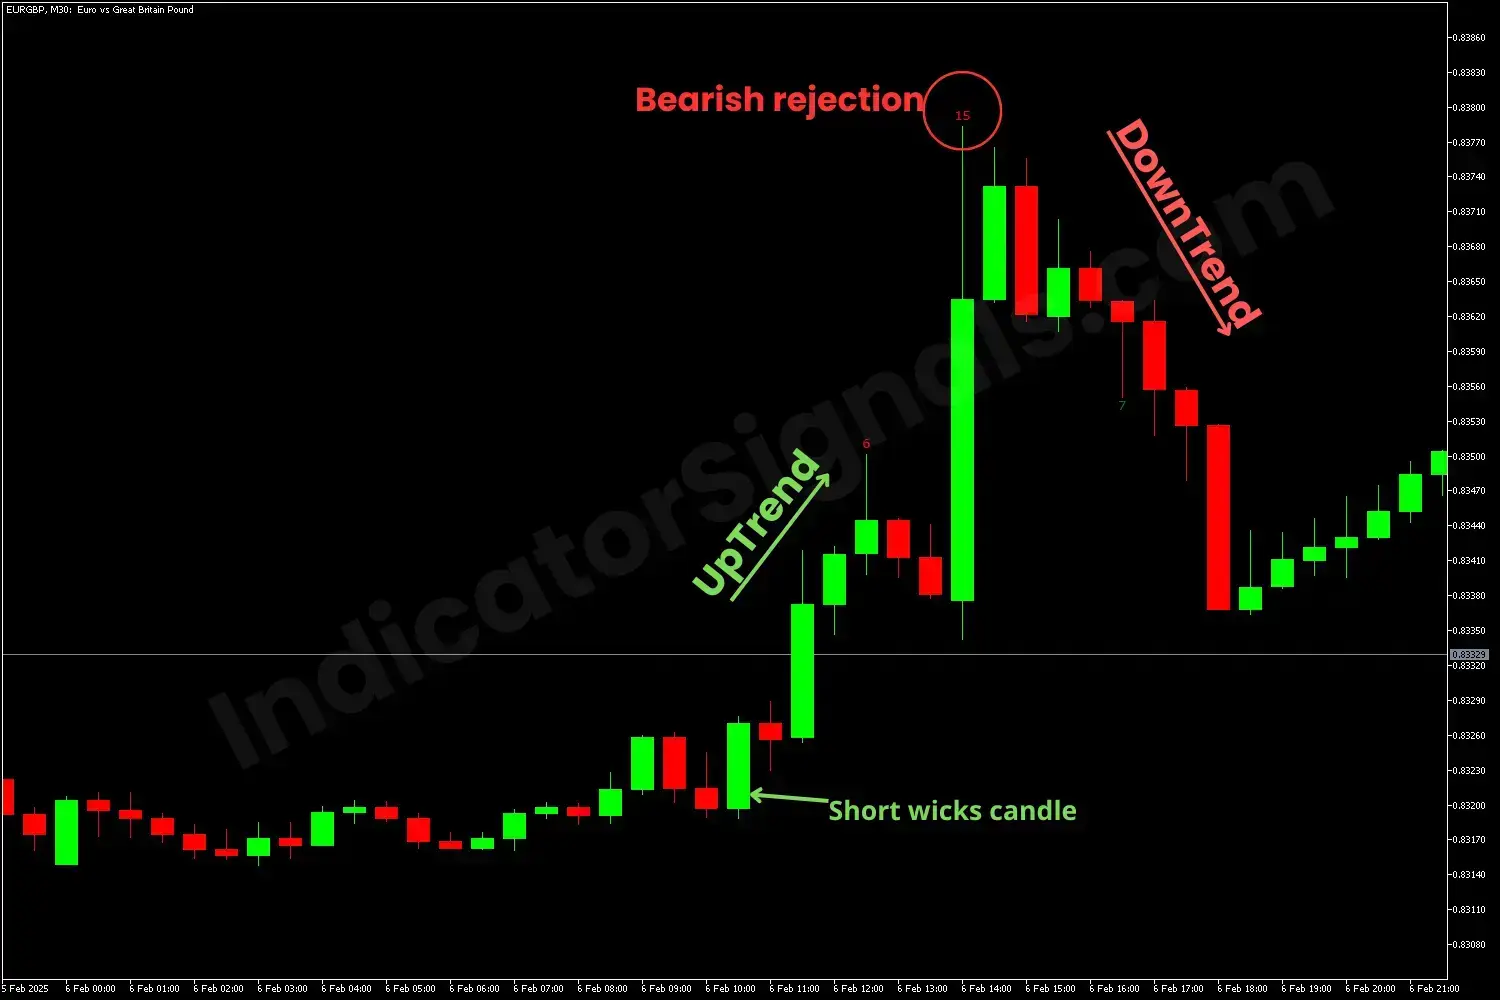
In the EURGBP chart on MT5, during an uptrend, a significant green candle with short upper and lower shadows appears, confirming the continuation of the upward trend. Toward the trend's end, a candle with long upper wicks forms, indicating bearish rejection and a shift into a downtrend.
To improve accuracy, combine this indicator with other technical indicators such as support & resistance indicator, moving averages, and RSI or Stochastic indicators, in order to make the best trade decisions.
IndicatorSignals.com - Owned & Operated By
FINANSYA LAB
|
2026 © All Rights Reserved.


