Version:
1.0
Updated:
25 February 2025
Downloads:
0
The Bollinger Squeeze Basic Indicator on MT4 is a complex technical analysis tool that combines two important indicators, which are the bollinger bands (BB) and the keltner channel (KC). This combination will aid traders visualize and highlight directly, on a MetaTrader 5 chart as well, the periods of high volatility (breakout phase) and low volatility (squeeze phase), which can help them identify entry and exit points.
The Bollinger Squeeze Basic (BSB) Indicator is a trend-following indicator that detects the periods of the trend's strength and consolidation phases, which will help traders make informed entry and exit points for their positions. This indicator works by measuring the relationship between two well-known indicators, the BB and KC (this indicator is available on our platform for FREE).
By applying the BSB, traders can visualize the two phases in a simple histogram with different colors. Here is the explanation of the two phases and how they work:
- Squeeze Phase (Low volatility): The blue squares on the zero level mean that the BB are inside the KC, suggesting a flat sideways market, and the trader shouldn't enter any position.
- Breakout phase (High volatility): The red squares on the zero line mean that the BB expand from the KC, signaling a price move up or down, which the histogram will help the trader identify the upcoming trend:
- The Green bars signal an upward trend, which is divided into darker green, which means a rising momentum ( strong uptrend), and lighter green, which means a falling momentum.
- The red bars signal a downward trend, which is divided into darker red, which means a rising momentum ( strong downtrend), and lighter red, which means a falling momentum.
Furthermore, this indicator is valuable for breakout trading strategies that will help the trader prepare for trend reversals or continuations. It can be customized to different volatility settings for improved trading insights.
To help traders understand how this indicator can be analyzed in a chart, I would present two different chart screenshots, each showcasing a different trading scenario:
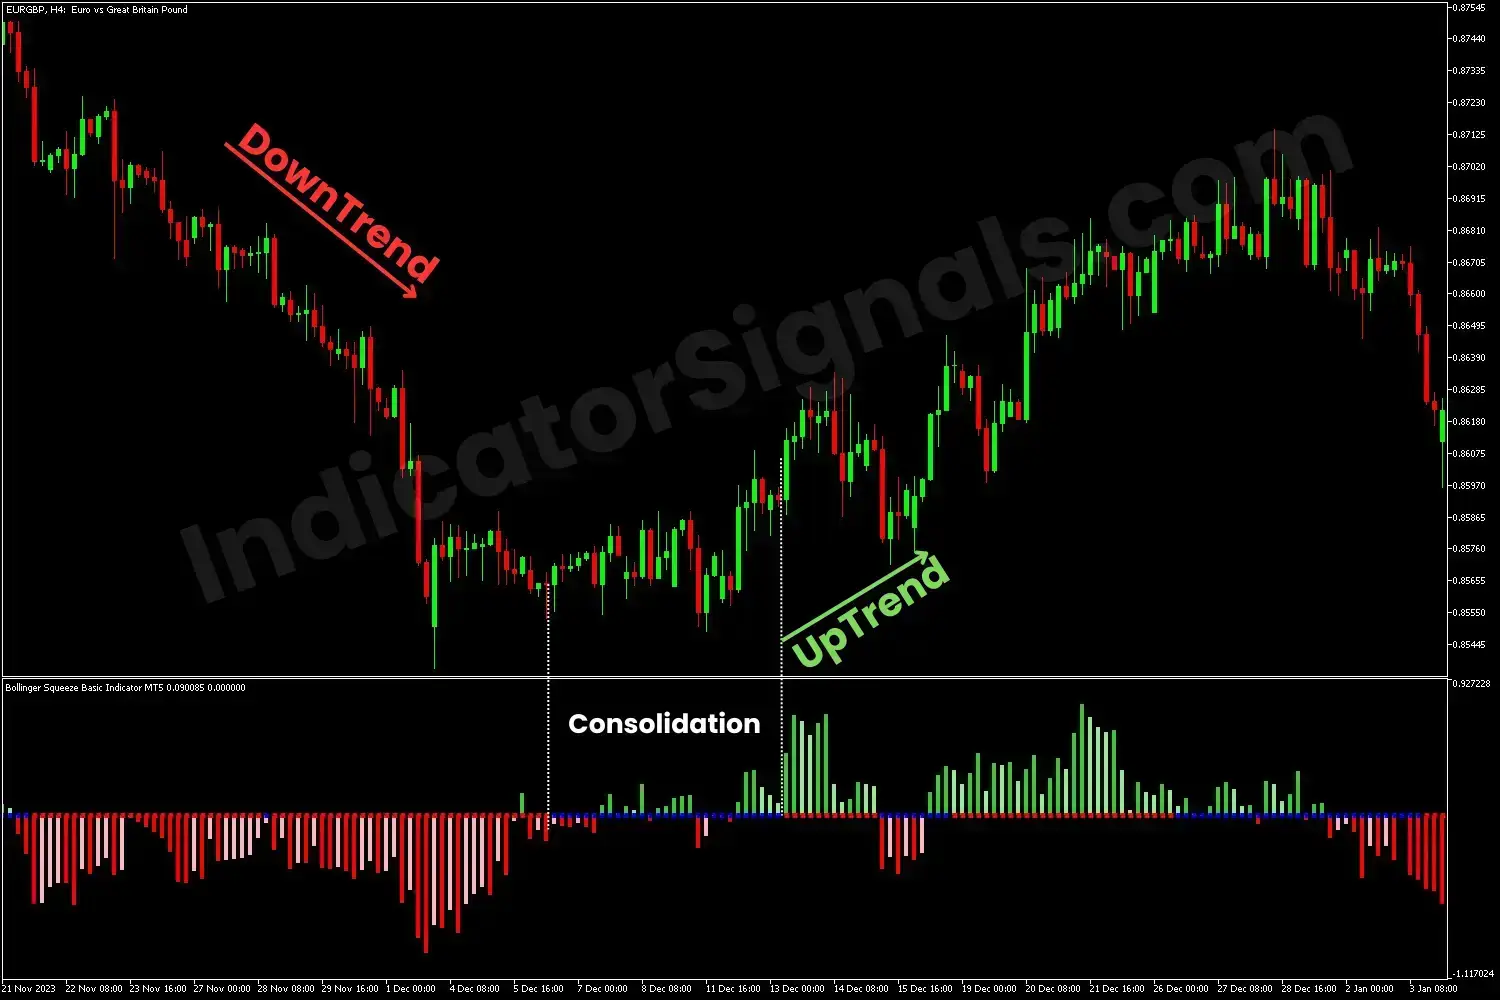
In the EURGBP chart on MT4, during the downtrend, the indicator displays red squares at the zero level, accompanied by significant red bars that confirm the continuation of the trend. Toward the trend's end, the BSB presents blue squares, suggesting a consolidation phase with low volatility that the trader should now exit his position and wait for a confirmation for a breakout. As expected, the red squares reappear, followed by dark green bars, signaling a long opportunity.
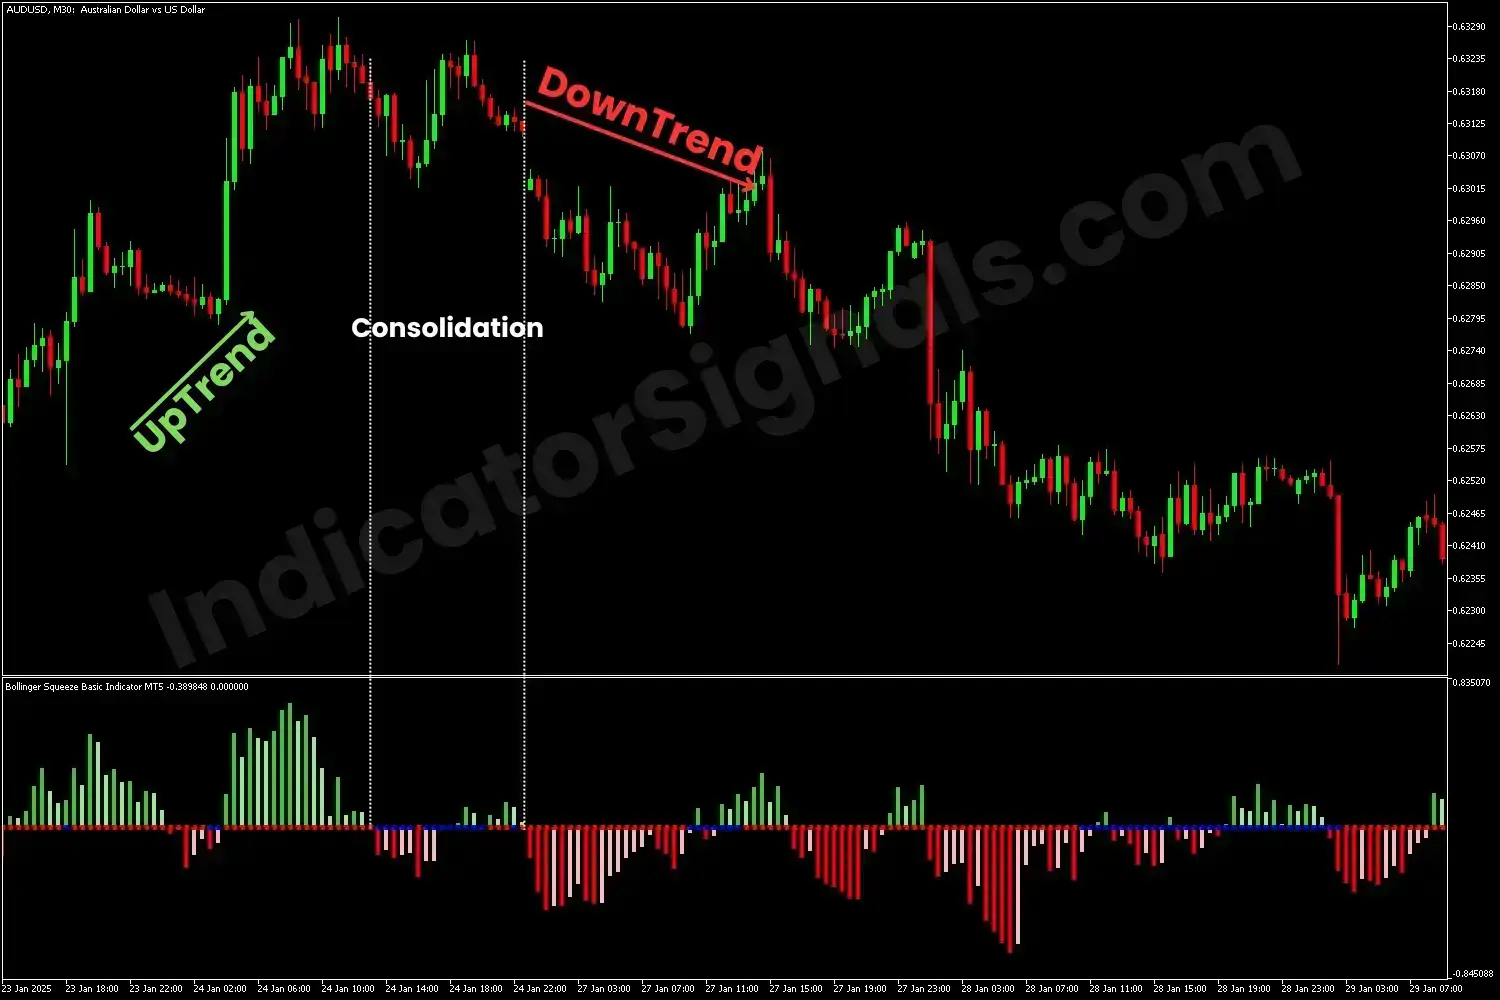
In the AUDUSD chart on MT5, during the uptrend, the BSB displays red squares at the balance line, accompanied by dark green bars that confirm the trend's continuation. Near the trend's end, this indicator presents blue squares, suggesting a sideways market condition, and the trader should anticipate a reversal. As expected, the red squares return, this time, followed by dark red bars, signaling a short opportunity.
IndicatorSignals.com - Owned & Operated By
FINANSYA LAB
|
2026 © All Rights Reserved.


