Version:
1.0
Updated:
25 February 2025
Downloads:
1
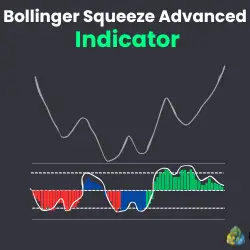
The Bollinger Squeeze Advanced Indicator on MetaTrader 4 is an advanced indicator of the Bollinger Squeeze Basic (BSB) indicator, available on our platform for FREE, that combines the Bollinger bands (BB) and the Keltner channel (KC) indicators. This indicator will help traders also, on an MT5 chart, identify trend direction and strength histogram based on one of the following eight oscillators: Stochastic, CCI, RSI, MACD, Momentum, Williams % Range, ADX, and DeMarker.
The Bollinger Squeeze Advanced (BSA) Indicator is a trend-following indicator designed to identify periods of strong and sideways trends, helping traders make informed entry and exit decisions. It works by analyzing the relationship between the two known indicators, the BB and KC (this indicator is available on our platform for FREE), similar to the BSB indicator. Furthermore, this advanced indicator, compared to the basic one, offers enhanced visual clarity and includes an oscillator that highlights overbought and oversold conditions by fluctuating between 0.25 and -0.25 levels.
Additionally, traders can visualize the two phases in a simple histogram with different colors. Here is the explanation of the two phases and how they work:
- Squeeze Phase (Low volatility):
- The blue histogram bars mean that the BB are inside the KC, suggesting a sideways market, and the trader should wait for a confirmation to make a decision.
- Breakout phase (High volatility):
- The Green bars signal an upward trend. When the bars increase consecutively, it means a rising momentum (strong uptrend). Conversely, when it decreases, it means a falling momentum.
- The red bars signal a downward trend. When the bars increase consecutively, it means a rising momentum (strong downtrend). Conversely, when it decreases, it means a falling momentum.
- Overbought and Oversold conditions:
- When the white line breaks above the 0.25 level, it means the market is in an overbought condition, and the trader should exit his long position and anticipate a bearish reversal.
- When the white line breaks below the -0.25 level, it means the market is in an oversold condition, and the trader should exit his selling position and wait to enter long.
The complexity of this indicator simplifies trading decisions by providing traders with diverse strategies, which can be further improved by integrating the other categories of technical analysis indicators, which are available for FREE and organized on our platform, such as volume and patterns indicators, for additional confirmation.
In this section, I am gonna provide our visitors with two trading examples to help them understand how they can use the BSA indicator to make informed trading decisions.
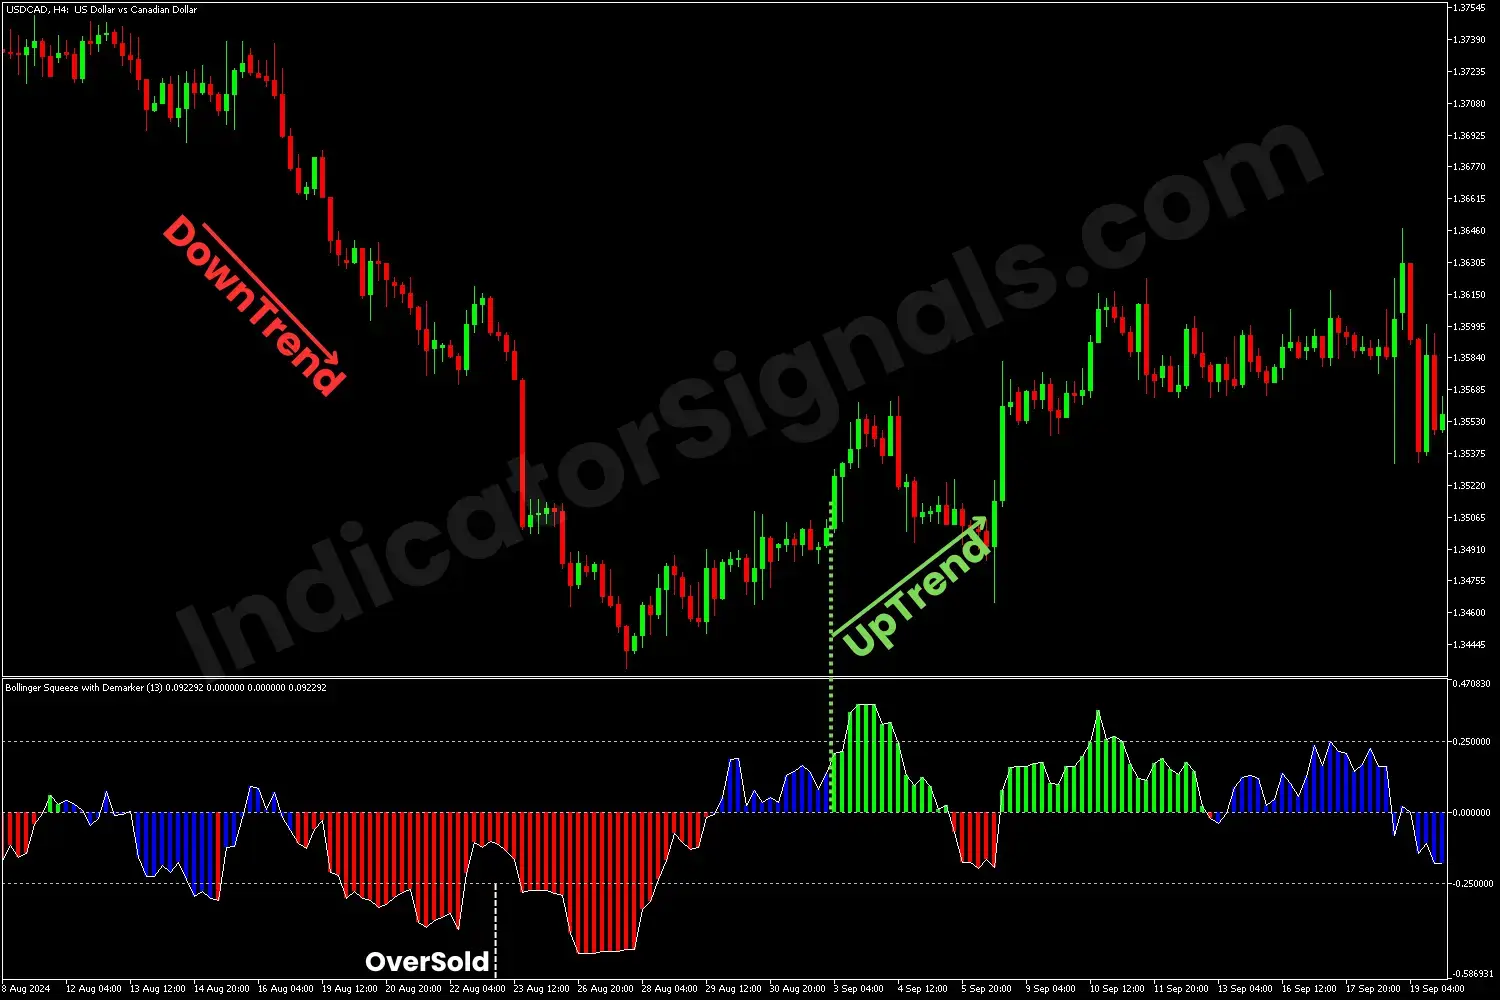
In the first example, using the USDCAD chart MT4, the BSA displays blue bars, indicating a consolidation phase, followed by red bars, signaling the beginning of the downtrend. As the white line surrounding the bearish bars reaches the oversold zone, it suggests a potential reversal, and the trader should wait for a confirmation to enter long at this moment. When the white line reaches the 0 level, then blue bars appear, suggesting a squeeze phase until green bars emerge, with high volatility, confirming the start of bullish momentum, at which point the trader can enter buying in the market.
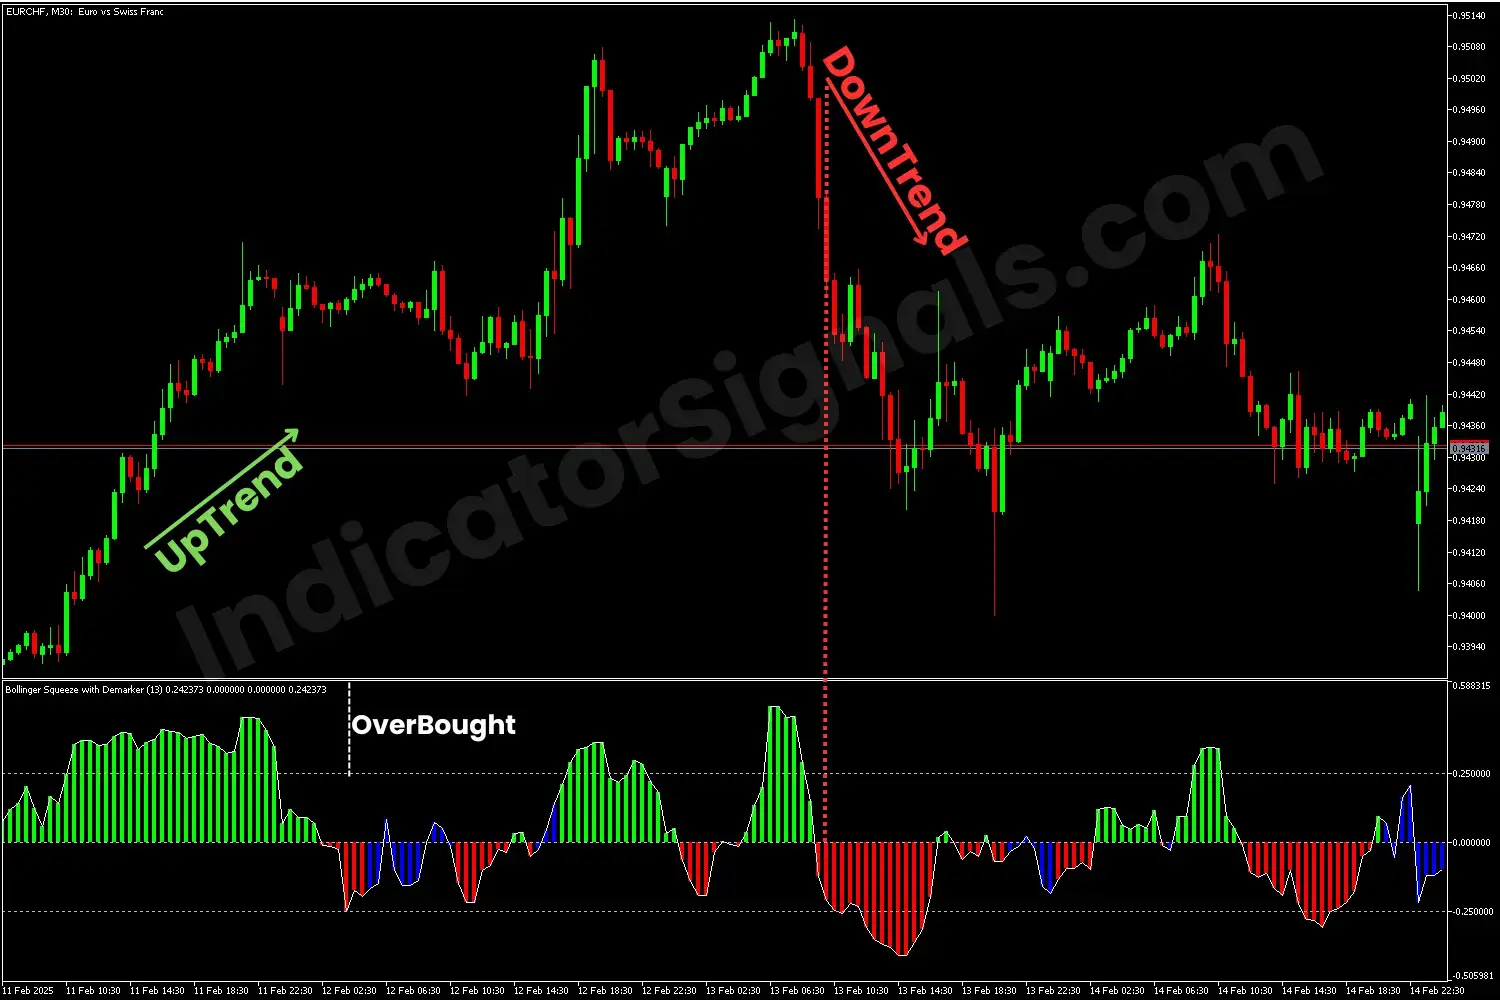
In the second example, using the EURCHF chart MT5, the BSA displays green bars, signaling a long opportunity for the trader. When they cross above the 0.25 level for the first time, the indicator signals a low volatility phase by presenting insignificant red and blue bars at the same moment. The green bars reappear, confirming the continuation of the uptrend. When the white line surrounding the bullish bars reaches the overbought zone on both times, that suggests a strong bearish reversal. As expected, the price enters a breakout phase, when important bearish bars appear, signaling the start of the downward trend, and the trader should enter short.
By presenting these two examples, traders can better master and understand the utility of the Bollinger Squeeze Advanced indicator for MetaTrader platforms, enabling them to make informed trading decisions.
IndicatorSignals.com - Owned & Operated By
FINANSYA LAB
|
2026 © All Rights Reserved.


