Version:
1.0
Updated:
26 May 2025
Downloads:
0
The Bollinger Bands Breakout indicator for MT5 highlights bullish and bearish breakouts beyond the classic Bollinger Bands. It displays breakout arrows, blue for breakouts above the upper band and red for breakdowns below the lower band, to help traders spot high-momentum entry points. The indicator also includes color-filled zones between the bands for better trend visualization.
The Bollinger Bands Breakout is a technical analysis indicator that enhances traditional Bollinger Bands with automatic breakout detection and visual alerts. It calculates standard Bollinger Bands using a 20-period simple moving average and a customizable deviation factor (default: 2).
In addition to the upper, lower, and middle bands, the indicator includes two key features:
- Filling Zones between bands (light green and pink areas) for easier trend visualization.
- Breakout Signals:
- Blue upward arrow when the price closes above the upper band, suggests a bullish breakout.
- A red downward arrow when the price closes below the lower band, suggests a bearish breakdown.
However, to make the best trading decisions based on this indicator, traders are advised to use the following strategies:
- Bullish Entry: When a blue arrow appears and the price breaks above the upper band, consider entering a long trade targeting further upward momentum.
- Bearish Entry: When a red arrow appears and the price breaks below the lower band, consider entering a short trade targeting downside continuation.
- Exit & Stop-loss: Consider using the middle Bollinger Band (gray dotted line) or a prior support/resistance level as your stop or take-profit area.
To highlight, the BBB indicator is particularly helpful in volatility breakout strategies and can serve both trend-following and momentum-based traders. And for accurate trading decisions, traders are encouraged to combine it alongside other categories of technical analysis indicators, such as RSI, MACD, and support and resistance.
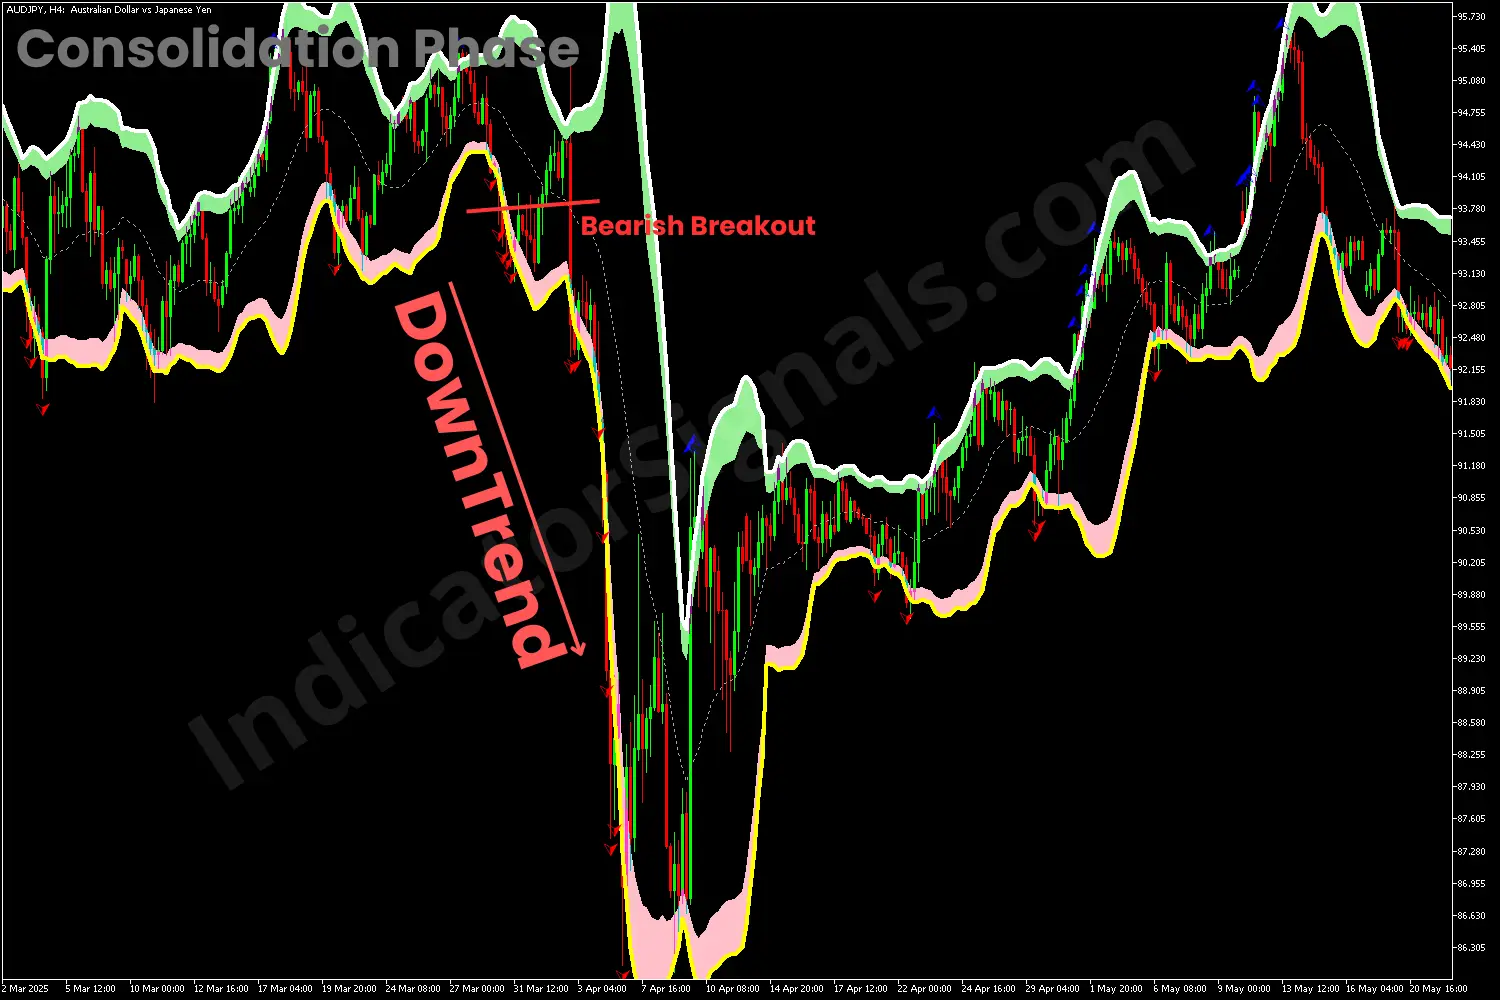
1/ When applying the BBB indicator to the AUDJPY chart, we can observe that the price initially moves within the Bollinger Bands channel, indicating a consolidation phase. However, when the price bounces off the upper band suggests a potential selling opportunity, while a rebound from the lower band indicates a buying opportunity.
Moreover, this enhanced version of the Bollinger Bands includes visual breakout signals in the form of arrows, which help traders identify stronger entries. In this specific case, a red arrow appears when the price breaks down below the lower Bollinger Band (Yellow), indicating a potential bearish breakout. This breakout signal is further confirmed by the appearance of consecutive red arrows, which reflect sustained bearish momentum.
This provides a clear and early short-selling opportunity for traders, as the indicator not only marks the breakout but also tracks its continuation. By acting on this signal, traders could benefit from the downward movement that follows the confirmed breakout.
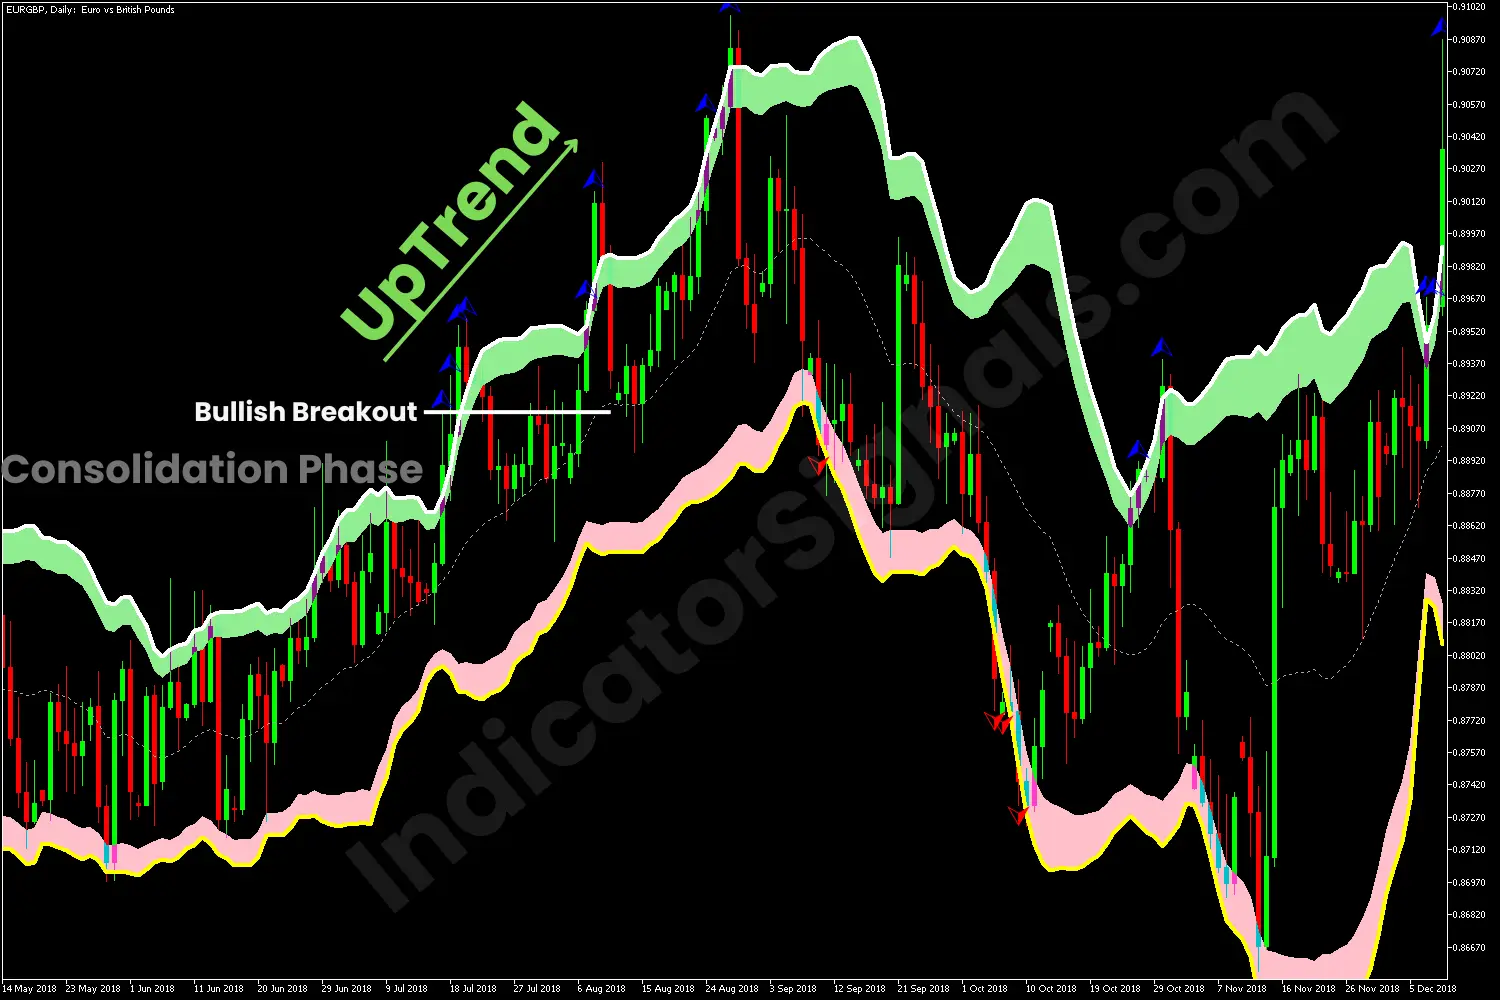
2/ By using the Bollinger Bands Breakout indicator in the EURGBP chart, we can observe that the price initially moves within the Bollinger Bands channel, indicating a sideways trend. However, when the price bounces off the upper band suggests a potential selling opportunity, while a rebound from the lower band indicates a buying opportunity, based on the classic Bollinger Bands indicator's signals.
Furthermore, this advanced version of the BB includes visual breakout signals in the form of arrows, which help traders identify potential entries. In this specific case, a blue arrow appears when the price breaks above the upper Bollinger Band (White), indicating a potential bullish breakout. This breakout signal is further confirmed by the appearance of consecutive blue arrows, which reflect continued bullish momentum.
This provides a clear and early long-buying opportunity for traders, as the indicator not only marks the breakout but also tracks its continuation. By acting on this signal, traders could benefit from the upward movement that follows the confirmed breakout.
IndicatorSignals.com - Owned & Operated By
FINANSYA LAB
|
2026 © All Rights Reserved.


