Version:
1.0
Updated:
26 February 2025
Downloads:
1
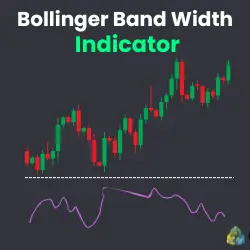
The Bollinger Band Width (BBW) on MetaTrader 4 is a technical analysis indicator derived from the classic Bollinger Bands, which calculates the difference between its outer bands. By downloading this indicator on an MT5 chart also for FREE, traders can easily identify market volatility, helping them confirm trend direction and anticipate potential breakouts to make optimal entry and exit points.
The BBW indicator, developed by John Bollinger in the 1980s, is a volatility-based indicator that measures the distance between the upper and lower Bollinger Bands, divided by the middle band.
Its formula is: BBW = [(Upper Band - Lower Band) / Middle band] * 100
Furthermore, when applied to a trading chart, the indicator provides a clear visualization of market volatility, helping traders determine whether the market is in a low-volatility sideways phase or a high-volatility during bullish or bearish movements. Each condition has specific interpretations, aiding traders in making informed decisions.
- Low BandWidth: Indicates price consolidation, traders should wait for an expansion to enter the market:
- If that happens and the price moves up, that suggests a breakout and indicates a buying opportunity.
- If that occurs and the price drops, that confirms the breakout and signals a short opportunity.
- High BandWidth: Suggests high volatility, confirming trend direction or breakout after the expansion.
- An increase in the BW during an uptrend signals a strong bullish movement.
- An increase in the BW during a downtrend confirms the bearish dominates in the market.
To further explain the usefulness of this indicator, I will demonstrate three trading examples to help traders apply it effectively for profitable decision-making.
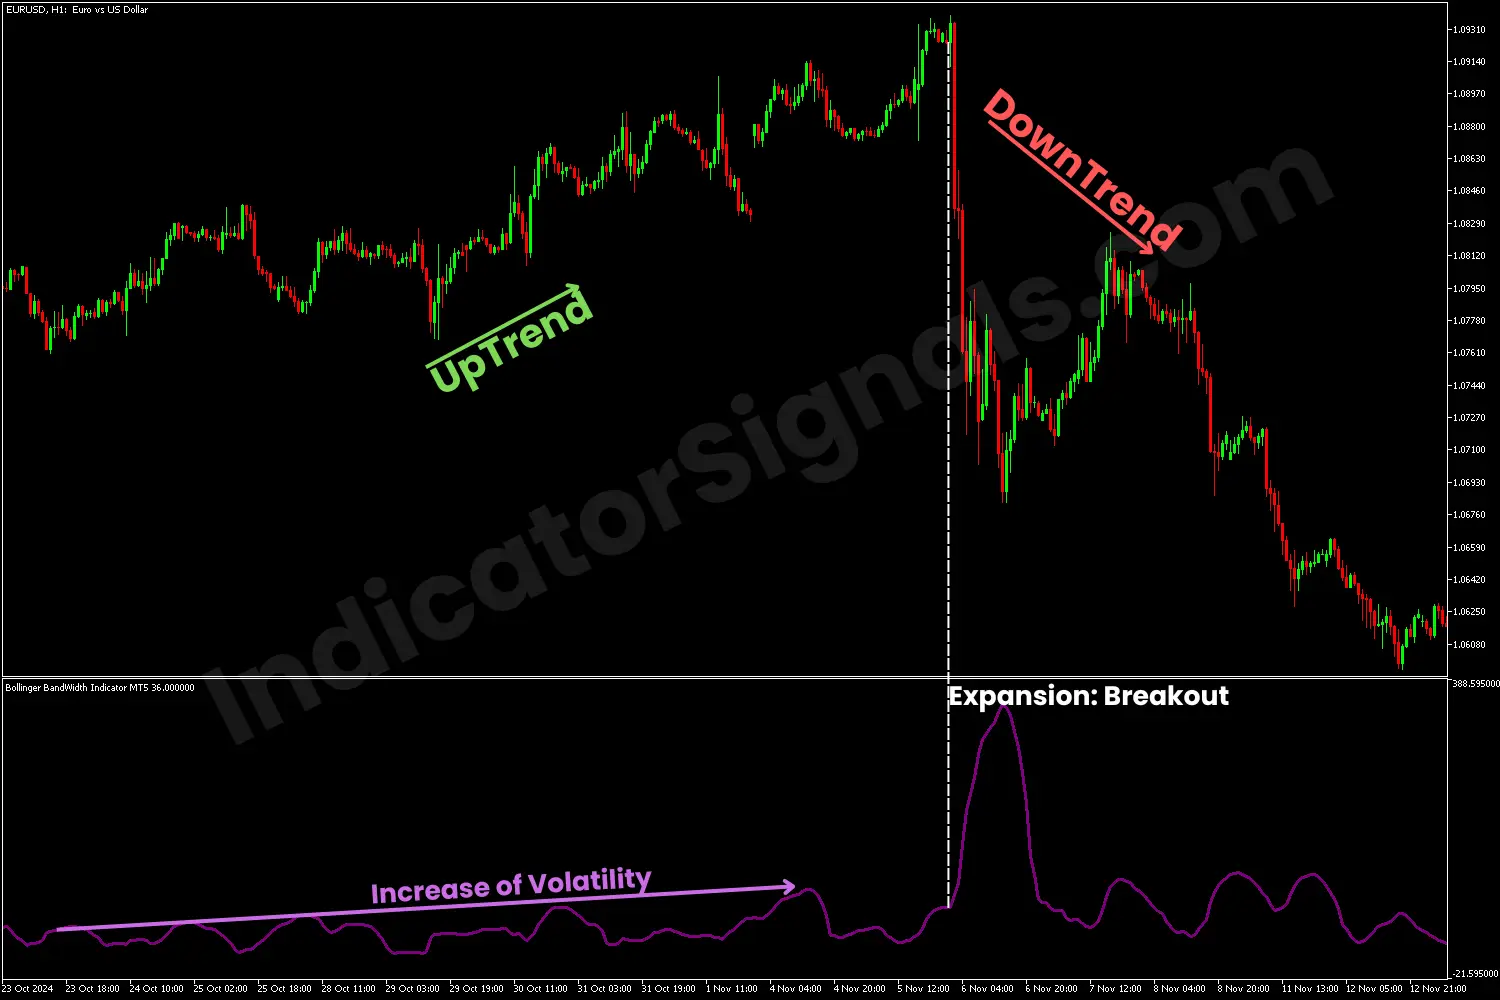
For the first example on an MT5 chart, during the uptrend, the BBW gradually increases, confirming the bullish momentum. Toward the trend's end, a sudden expansion in the indicator suggests a breakout, alongside a significant bearish candle, which signals a bearish reversal, and the trader should exit his long position and enter a short trade.
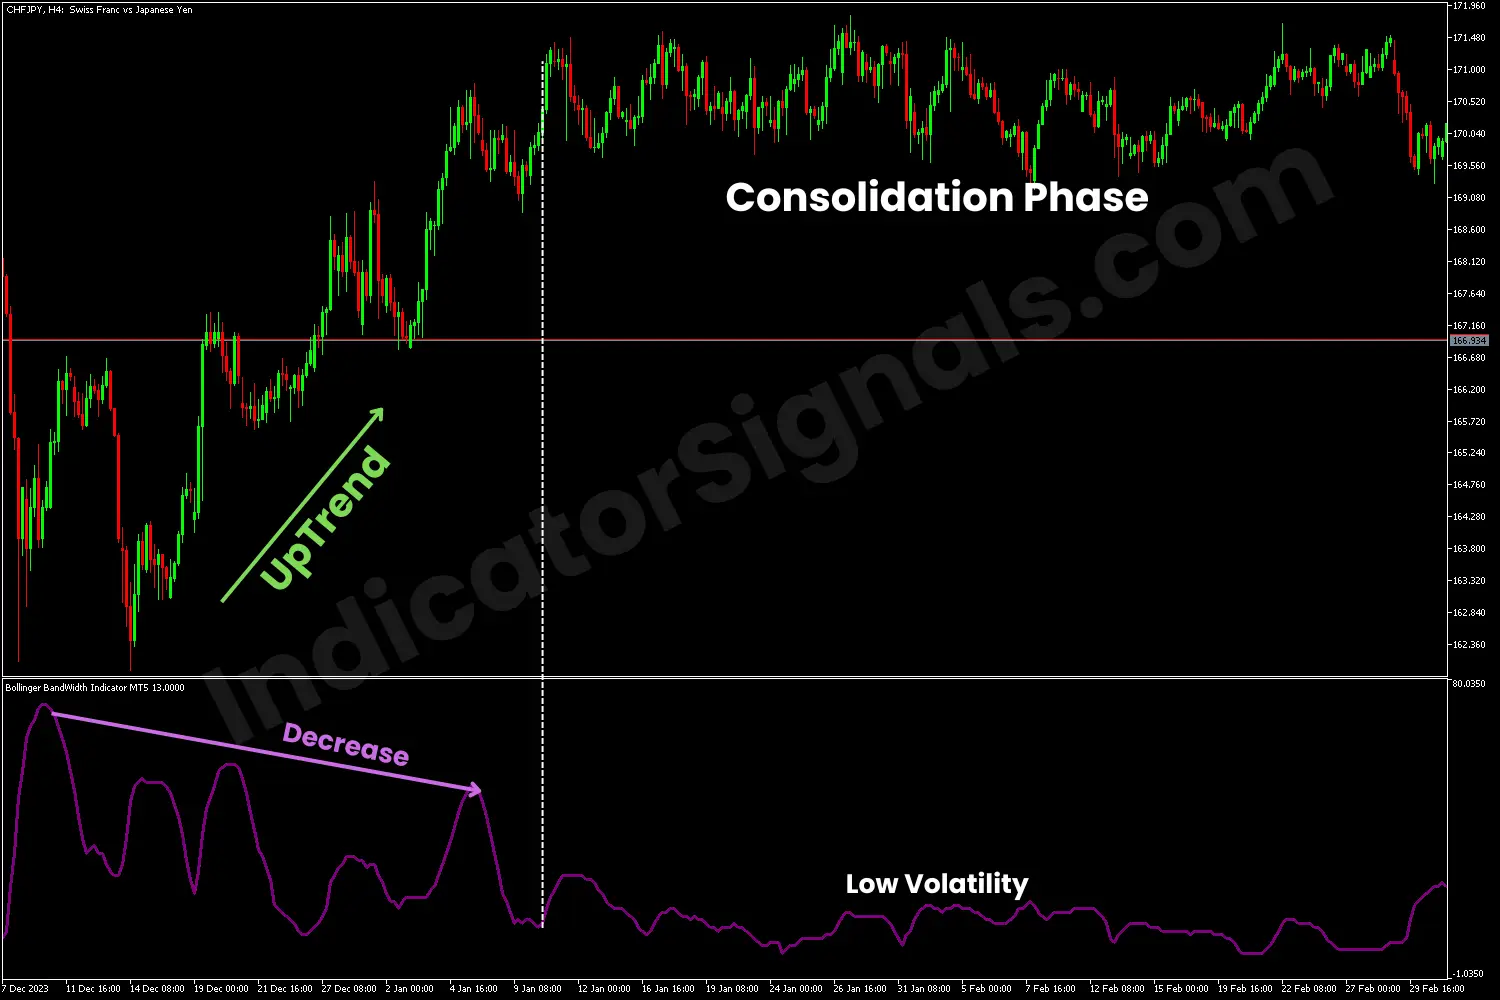
For the second example on an MT4 chart, during the uptrend, the BBW begins to decrease, which suggests a loss of volatility in the market. When the indicator reaches its low value, that signals a low volatility and the market will enter a consolidation phase. The trader should exit his long position and wait for a breakout in the coming hours to reenter the market, whether long or short.
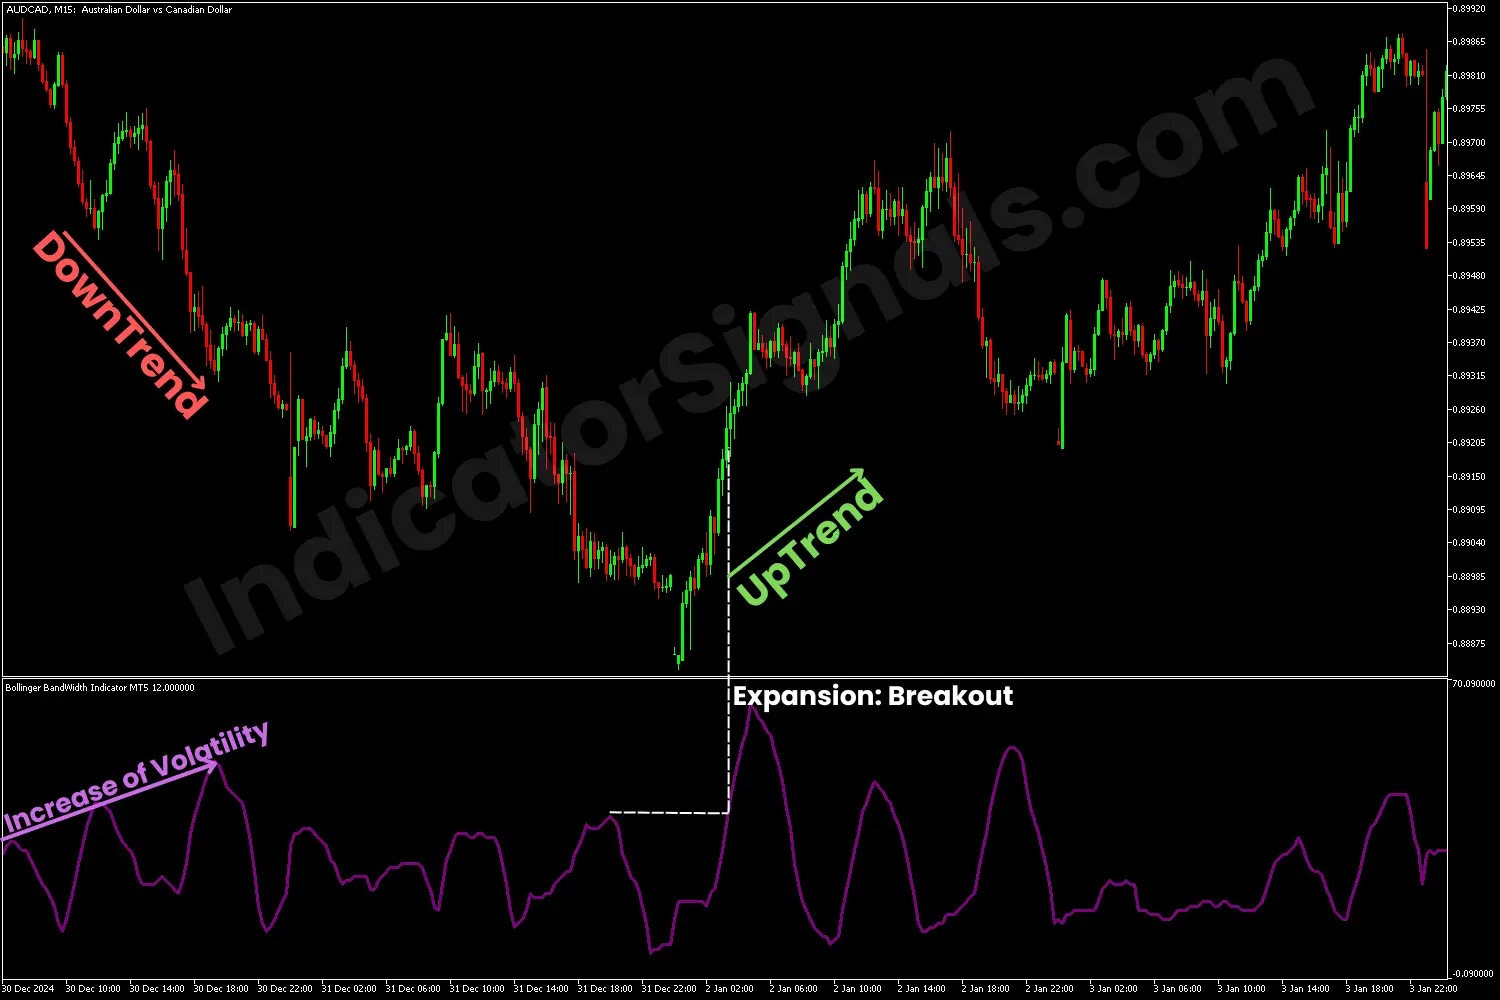
For the last example on an MT5 chart, at the beginning of the downtrend, the indicator shows an increase in volatility that confirms the continuation of the bearish movement. During the downtrend, the BBW loses strength, indicating low volatility and market hesitation. But when a sudden expansion occurs, with a bullish candle appearing, that confirms a bullish reversal, and the trader should exit his short position and enter long.
IndicatorSignals.com - Owned & Operated By
FINANSYA LAB
|
2026 © All Rights Reserved.


