Version:
1.0
Updated:
25 February 2025
Downloads:
0
The BB MACD Indicator for MetaTrader 4 is a modified version of the classic MACD indicator, that incorporates the Bollinger Bands into the MACD line instead of the price chart. When applied to an MT5 chart also, this indicator helps traders analyze the market volatility, identify the market direction and strength, and even anticipate potential reversals.
The BB MACD indicator is classified as a trend-following indicator, combining two traditional indicators, BB and MACD, as the first is directly applied to the macd line. This modification allows traders to easily visualize the market's volatility, whether in a sideways, bullish, or bearish trend. This indicator aids traders in identifying market direction, spotting potential reversals, and determining optimal entry and exit points.
Furthermore, this indicator consists of a central dotted line, where the lime dots indicate bullish momentum, and the magenta ones signify bearish movement. These dots fluctuate between two bands, a blue upper band (resistance) and a red lower band (support). The combination of these elements allows for multiple interpretations, such as :
- Low volatility:
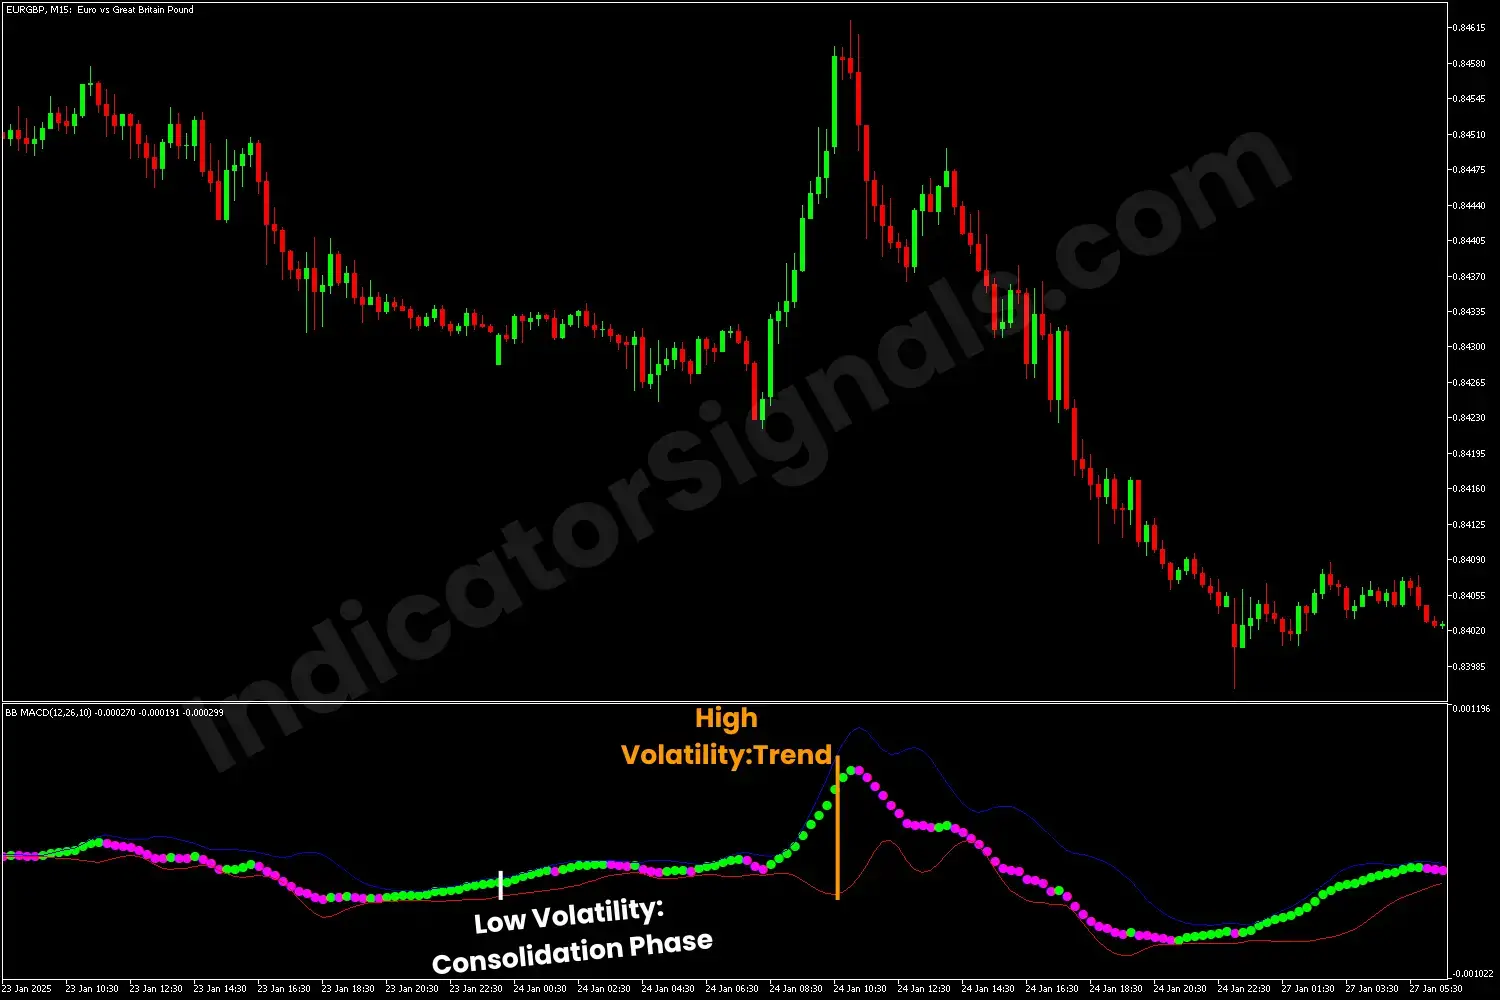
When the two bands contract and the dots are colored lime or magenta, that signals a sideways market. Traders should wait for a breakout to enter the market.
- High volatility:
If the two bands expand that signifies a high volatility market and the trader should look for potential short or long entries by analyzing the movement of the dots:
- Potential reversals: When the dots change color from lime to magenta which signals a bearish reversal with a breakout of the last support line. Conversely, if the dots change color to lime that signals a bullish reversal with a breakout of the last resistance line.
- Trend strength: If the lime dots are moving near the blue band that signals a bullish strength, and if the magenta dots are moving near the red line that signals a bearish strength.
In the first example, as shown on the MT5 chart, when the two bands are contracting, that signals a low volatility market condition and there's no trading opportunity. As the two bands expand, signaling high volatility, at this moment, traders should look for a trading opportunity whether buying or selling in the market.
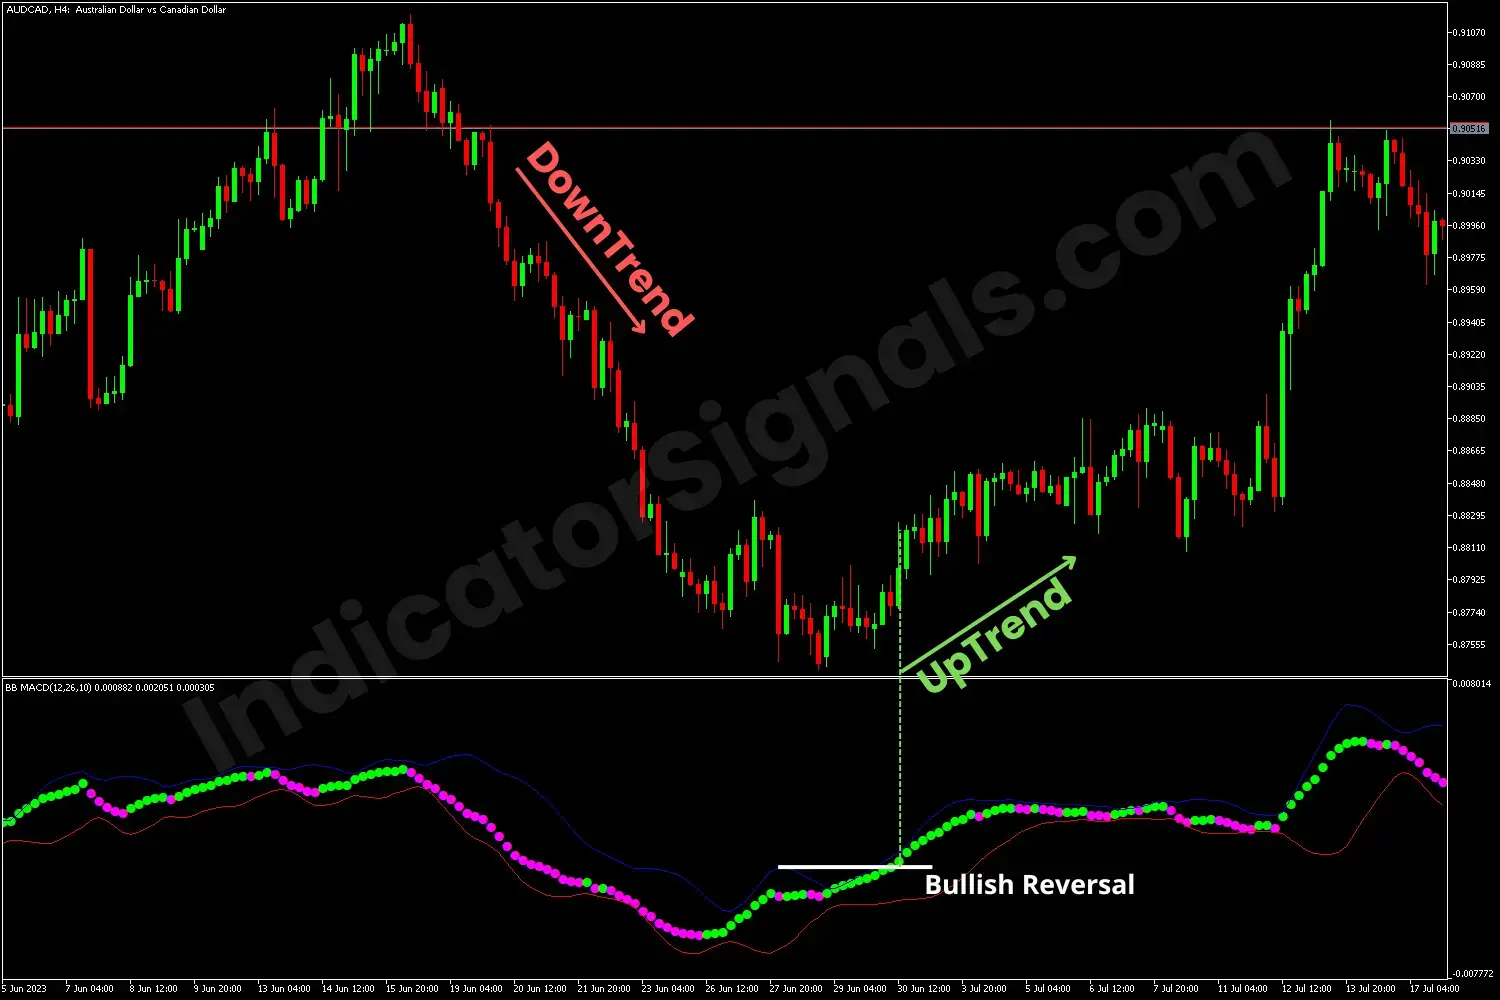
In the second example, in a high volatility market, during the downtrend, the magenta dots are closing to the red line, which confirms the continuation of the bearish momentum. As the central line begins to move up with lime dots, and with a break above the last resistance level, as shown on the MT4 chart, that signals a bullish reversal. The trader in this situation should exit his short position and enter a long one.
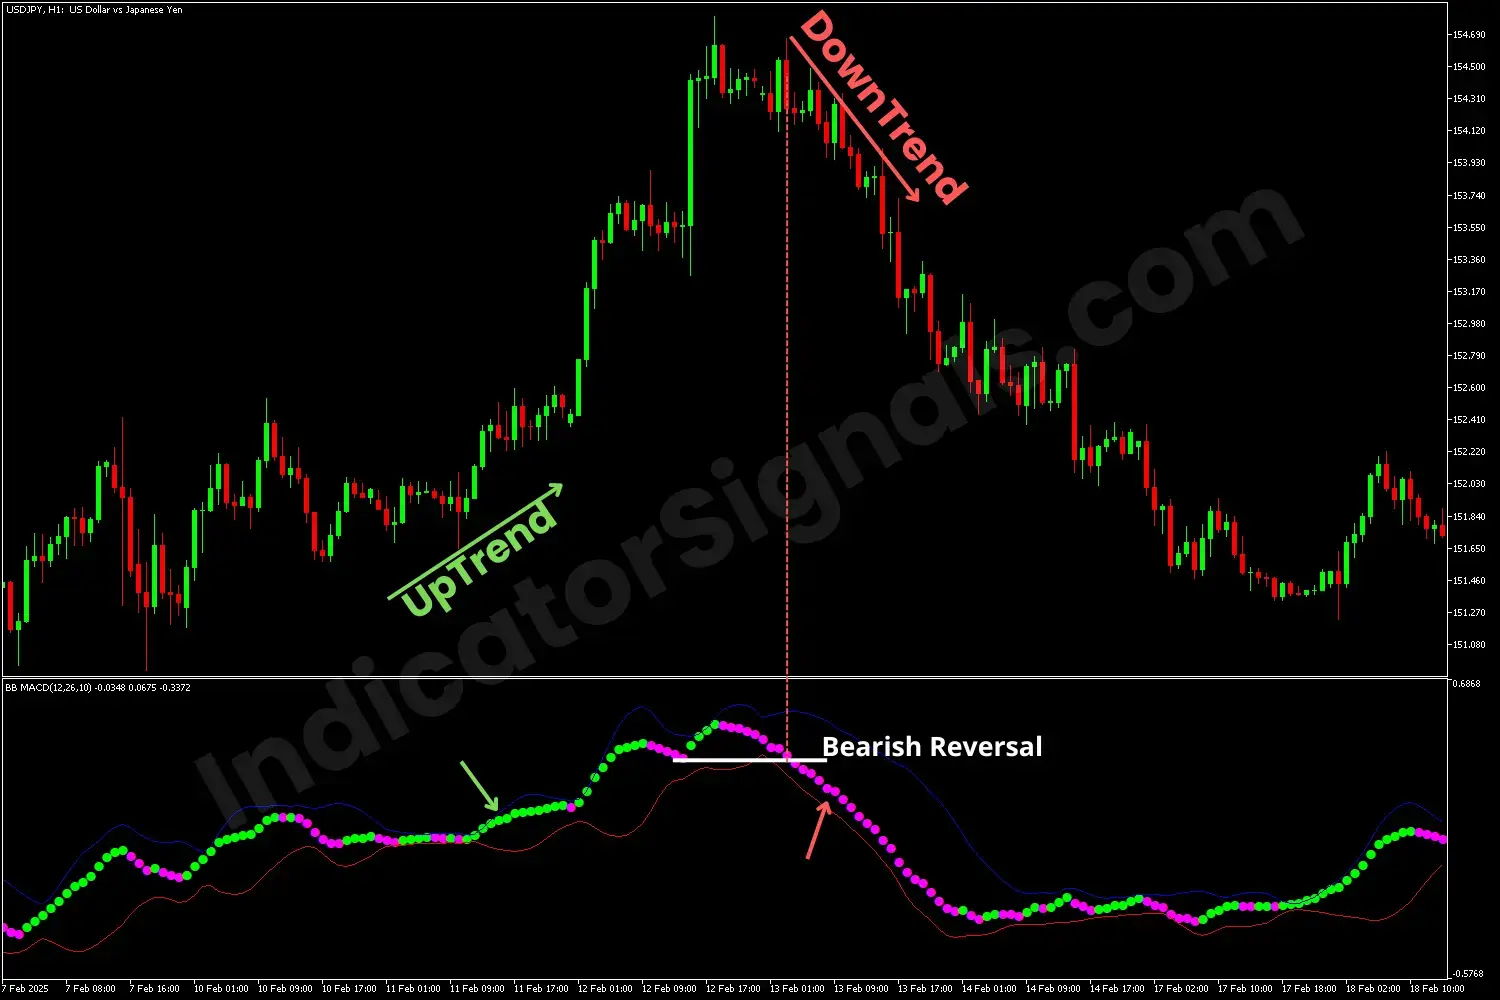
In the third example, in a high volatility market as well, during the uptrend, the lime dots are closing to the upper band, which confirms the continuation of the bullish momentum. As the central line starts to move down with magenta dots, and with a break below the last support level, as shown on the MT5 chart, that signals a bearish reversal. The trader at this moment should exit his buying position and go short.
IndicatorSignals.com - Owned & Operated By
FINANSYA LAB
|
2026 © All Rights Reserved.


