Version:
1.0
Updated:
13 May 2025
Downloads:
2
The Awesome Oscillator (AO) for MetaTrader 4 is a technical analysis indicator that measures market strength by comparing recent and longer-term price movements. Also available on the MT5 platform, this histogram-based tool helps traders identify trend direction, spot potential reversals, and confirm momentum shifts for more accurate entry and exit strategies. Measure market momentum and confirm trend direction with clear visual signals.
The Awesome Oscillator (AO) is a momentum-based indicator developed by Bill Williams to gauge the current market momentum compared to a broader historical context. It calculates the difference between a 5-period and a 34-period simple moving average (SMA), both applied to the median price [(High+Low)/2].
On both MetaTrader charts, the AO is displayed as a histogram with bars oscillating around a central zero line:
- Green bars indicate that the current value is higher than the previous bar (increasing bullish momentum).
- Red bars signal that the current value is lower than the previous bar (increasing bearish momentum).
- Bars above zero reflect bullish momentum.
- Bars below zero reflect bearish momentum.
The AO is primarily used to confirm trends and anticipate reversals through recognizable patterns:
1* Twin Peaks Bars Strategy:
- Bullish Twin Peaks: Two lows below zero, with the second higher than the first, followed by a green bar, indicating a potential upward reversal.
- Bearish Twin Peaks: Two highs above zero, with the second lower than the first, followed by a red bar, signaling a potential downward reversal.
2* Zero Line Crossover:
- Bullish Signal: The histogram crosses from below to above zero, suggesting strengthening upward momentum.
- Bearish Signal: The histogram crosses from above to below zero, signaling weakening momentum or a potential downtrend.
3* Saucer Setup:
+ Bullish Saucer: Three bars above zero where the middle bar is red and shorter than the other two. Indicates a brief pause in momentum before continuing upward.
+ Bearish Saucer: Three bars below zero where the middle bar is green and shorter. Suggests a short retracement before a further decline.
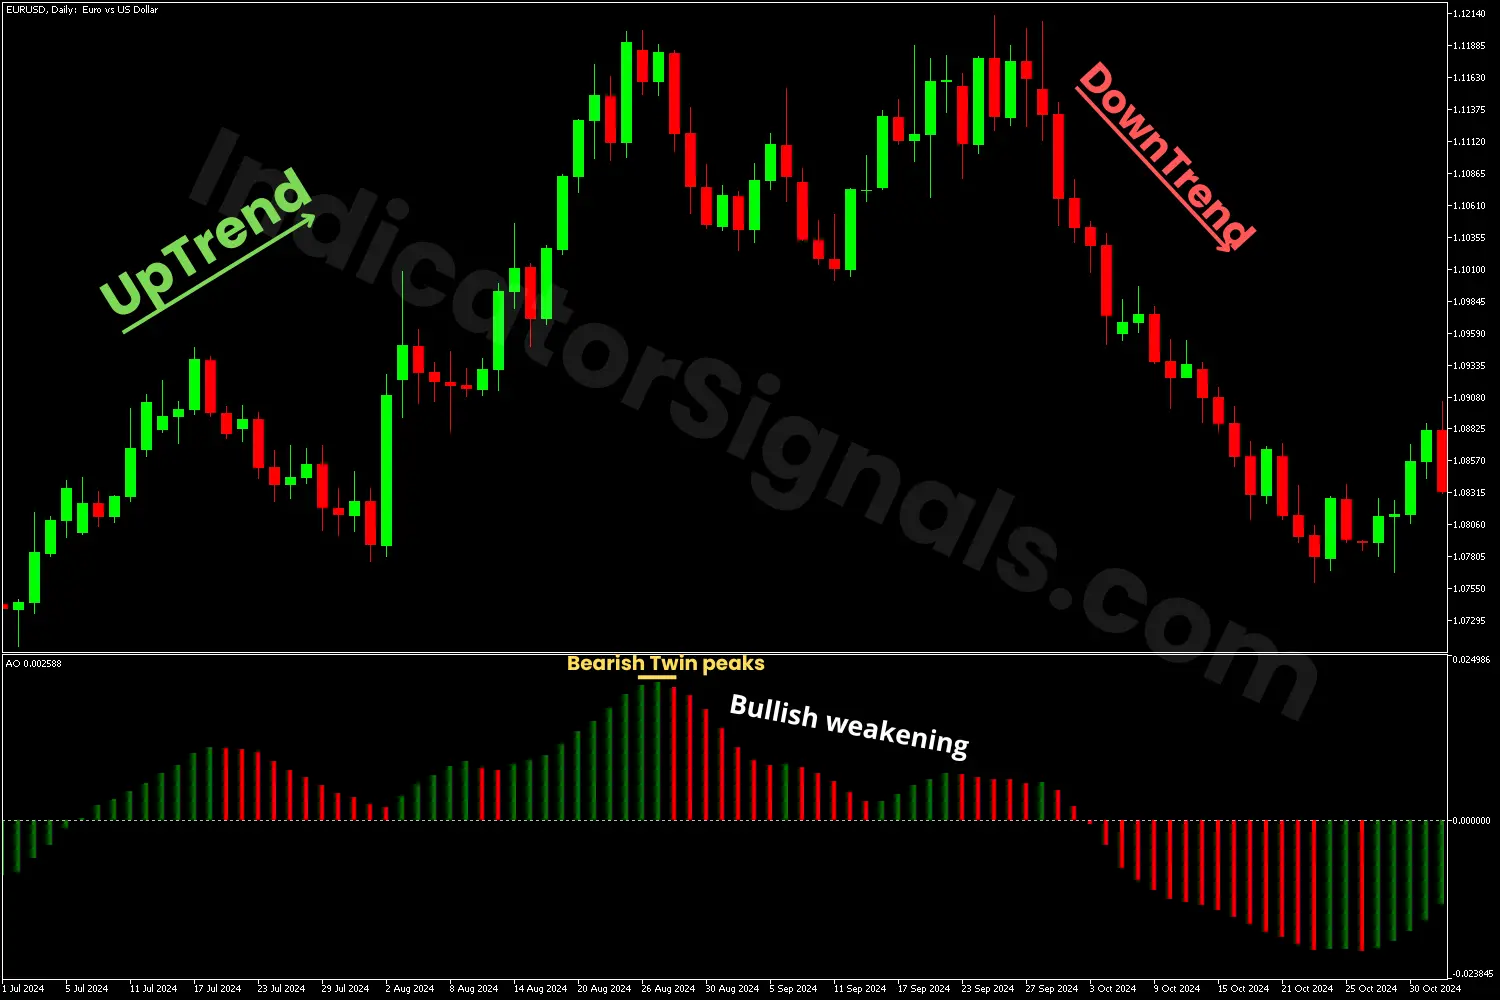
1- In the EURUSD chart example, I applied the MT5 version of the Awesome Oscillator to analyze the market trend. The indicator confirmed a bullish movement when the histogram bars turned green and crossed above the zero line, signaling a potential buy opportunity. The uptrend continued, followed by a brief correction phase shown by red bars. However, since these red bars remained above the zero line, the trend remained upward.
The trend gained strength again as green bars reappeared, supporting the upward move. Later, the indicator formed bearish Twin Peaks bars, followed by a series of bearish bars and weak bullish bars, even as the price continued rising. This divergence suggested a weakening bullish momentum and a possible bearish reversal. The confirmation came when the histogram crossed below the zero line with red bars, providing a valid short entry signal.
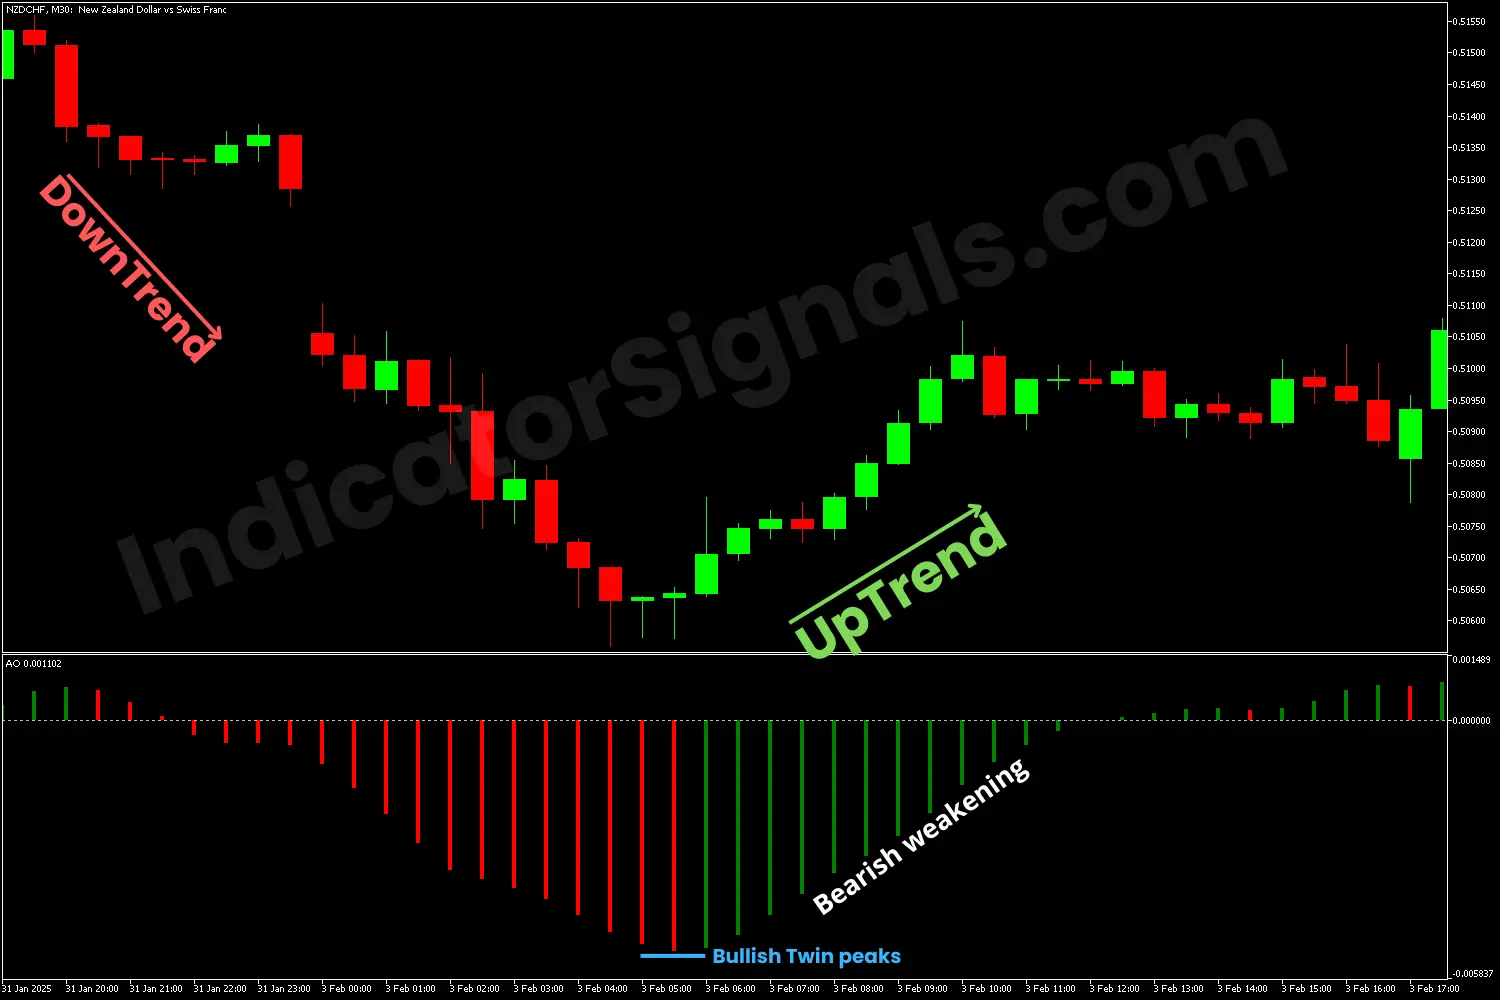
2- In the NZDCHF chart example, I applied the MT4 version of the Awesome Oscillator to analyze the market trend. The indicator confirmed a bearish movement when the histogram bars turned red and dropped below the zero line, signaling a potential sell opportunity.
Toward the trend's end, the indicator formed bullish Twin Peaks bars, followed by a series of bullish bars. This weakening bearish momentum suggested a possible bullish reversal. When the histogram rose above the zero line with green bars, it signaled a long entry.
IndicatorSignals.com - Owned & Operated By
FINANSYA LAB
|
2026 © All Rights Reserved.


