Version:
1.0
Updated:
02 June 2025
Downloads:
6
The Auto TrendLine Indicator for MetaTrader 4 is a technical analysis tool designed to detect and draw trendlines based on price action, eliminating the need for manual analysis. This indicator, which is available for FREE on the MT5 chart as well, displays two lines acting as support and resistance lines, helping traders identify market direction and determine potential breakouts, in order to make optimal trade decisions with accurate entry and exit points.
The Auto TrendLine (ATL) is a trend-following technical analysis tool developed to draw key trendlines on the MetaTrader chart. By eliminating the need for manual plotting, it saves traders time, reduces subjectivity, and enhances the accuracy of trend analysis. Its main function is to provide a clear and dynamic visualization of the prevailing market structure.
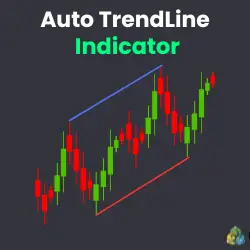
Once applied to a trading chart, the ATL automatically plots two primary trendlines:
- A downward-sloping blue line acts as a resistance level during bearish phases.
- An upward-sloping red line, which serves as a support level during bullish conditions.
These trendlines adjust in real-time as new price data becomes available, helping traders track evolving market direction, monitor trend continuation, and detect potential breakout zones.
- Trend Continuation Strategy:
- Uptrend Scenario: When the price pulls back and rebounds from the red support line, it suggests that the trend remains intact, offering a buying opportunity.
- Downtrend Scenario: When the price rallies and bounces off the blue resistance line, it indicates the continuation of bearish momentum, presenting a short-selling opportunity.
- Breakout Strategy:
- Bullish Breakout: If the price closes above the blue resistance line, this signals that buyers are gaining strength, providing a potential long entry as a new uptrend may form.
- Bearish Breakout: If the price falls below the red support line, this suggests bearish pressure is taking over, offering a potential short entry as a new downtrend may begin.
The ATL indicator simplifies the detection of support and resistance zones by mapping key trendlines based on price action. It is a valuable tool for traders aiming to spot trend continuations and capitalize on breakout opportunities without relying on manual chart analysis.
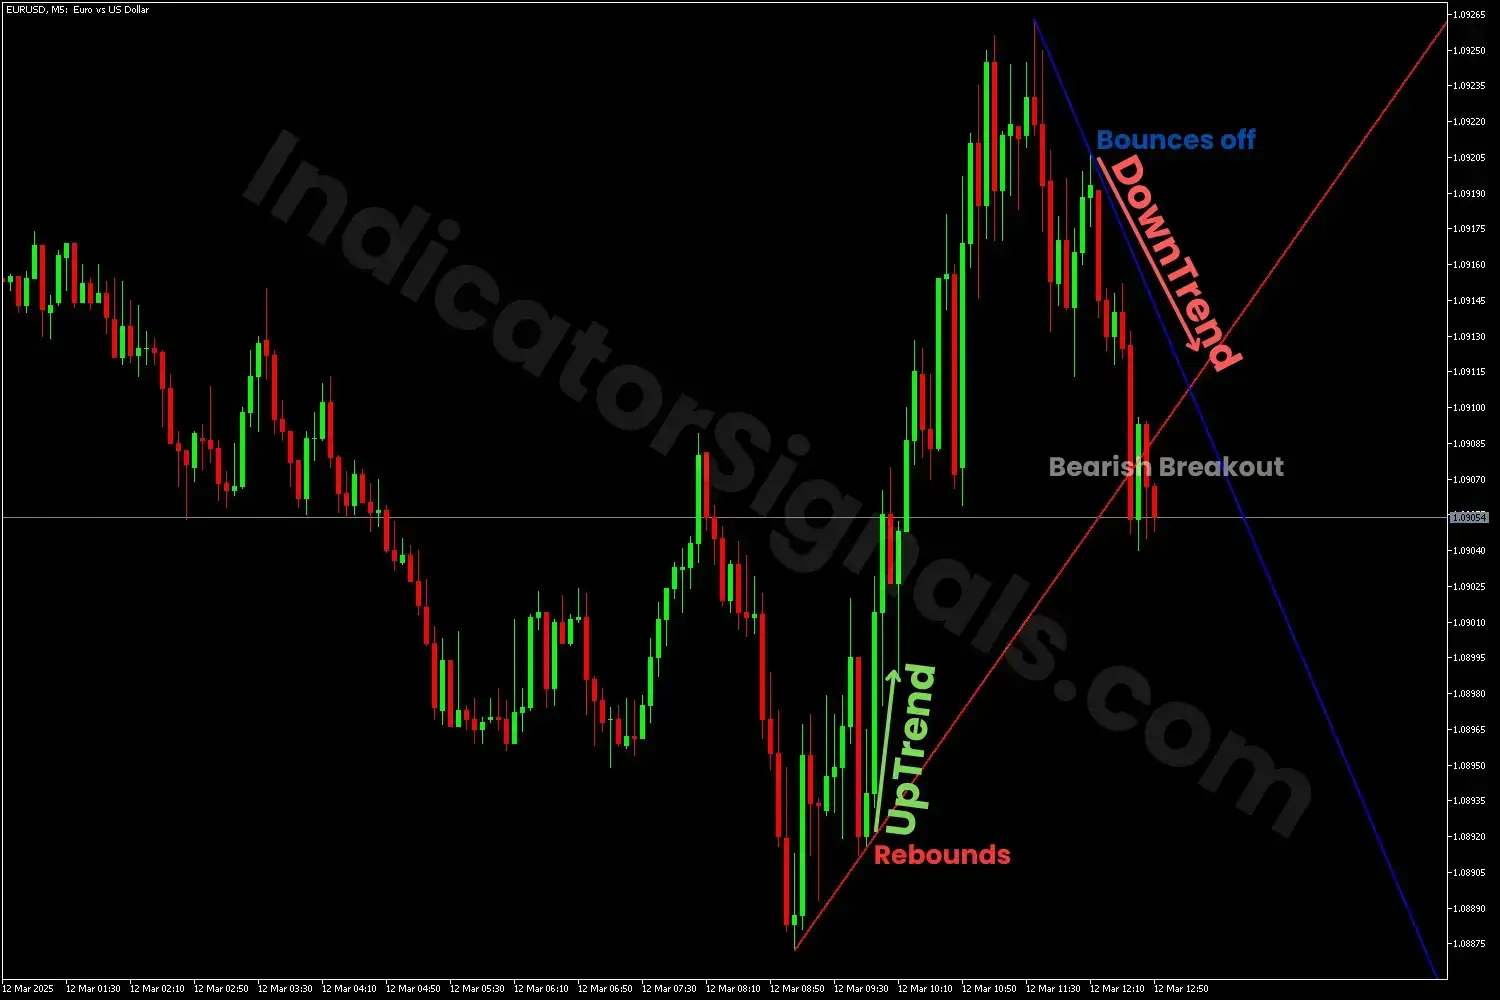
1* In the first example on a MetaTrader 4 chart, during an upward trend, the price rebounds from the red upward trendline, which acts as a support level. This confirms the continuation of the bullish momentum and provides a potential buying opportunity.
As the trend progresses, the price reaches the blue downward trendline and gets rejected. This signals a possible trend exhaustion or a correction. When the price fails to break above the resistance and gets rejected once again, it suggests the continuation of the bearish movement. Eventually, once the price breaks below the red support line, it confirms a bearish breakout, offering a strong short entry for traders.
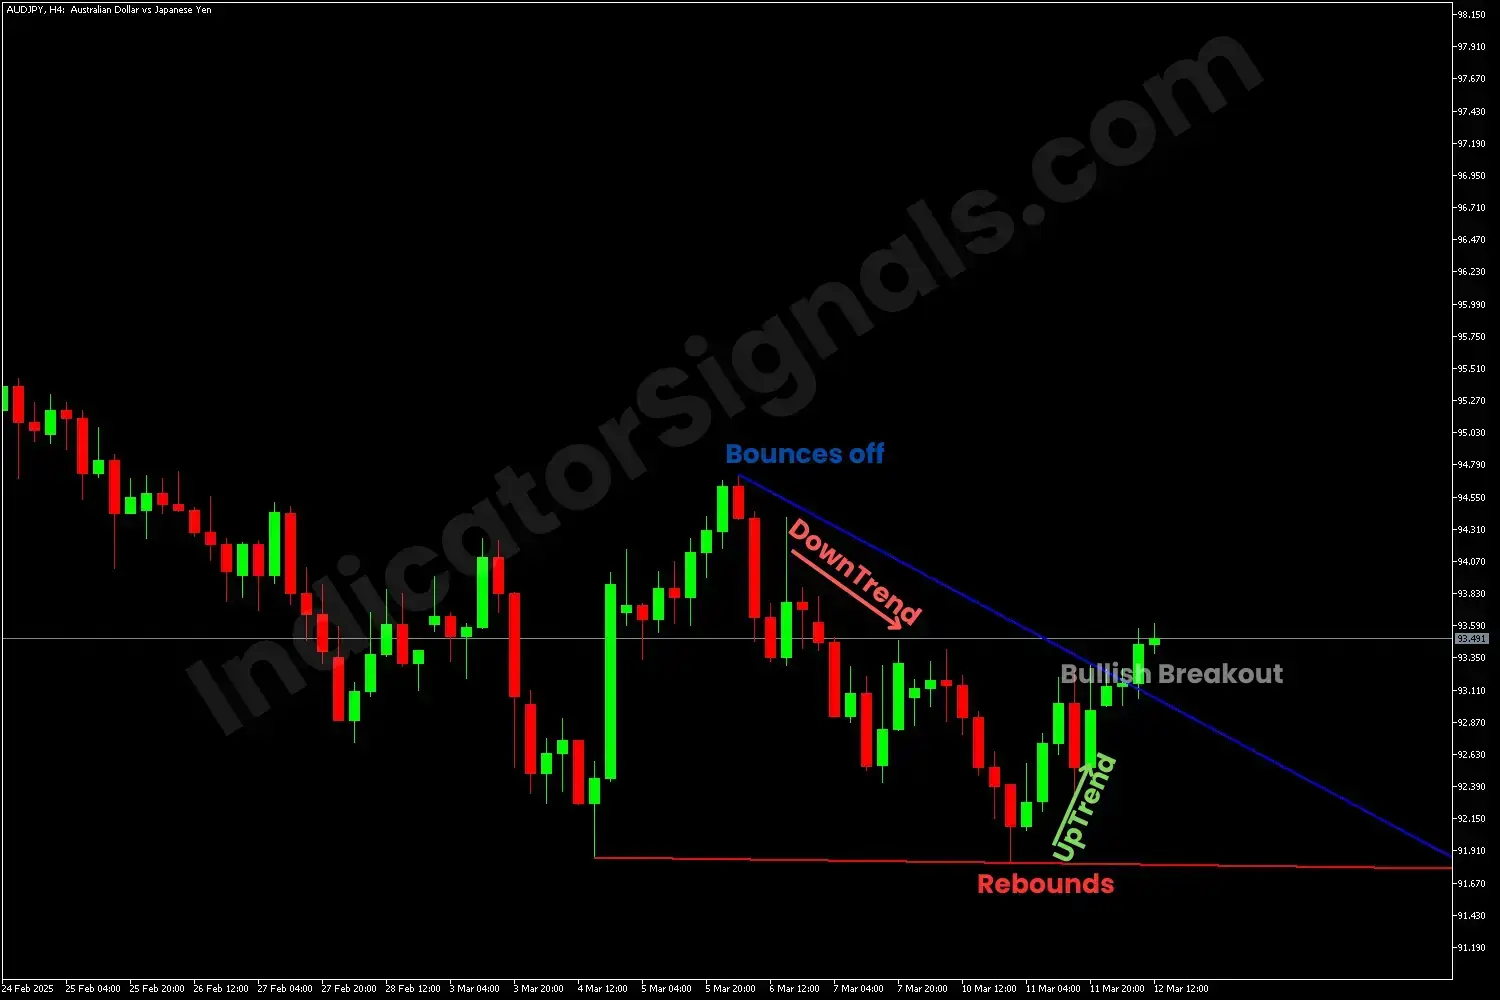
2* In the second example on a MetaTrader 5 chart, during a prevailing downtrend, the price bounces off the blue downward trendline, confirming the continuation of the bearish pressure. This presents a valid short-selling opportunity.
Toward the trend's end, the price finds support at the red upward trendline and rebounds, indicating a possible bullish correction or trend reversal. When the price successfully breaks above the resistance level, it signals a bullish breakout and a potential buying opportunity for the trader.
To make well-informed and accurate trade decisions using the Auto TrendLine indicator, traders are advised to:
- Wait for confirmation through clear bullish or bearish candlestick patterns before entering a trade.
- Combine ATL with other technical indicators, such as oscillators, volume tools, or price action strategies, to filter out false signals and enhance trading accuracy.
All these complementary indicators are available for FREE on our platform, providing a complete and reliable solution for traders at every level.
IndicatorSignals.com - Owned & Operated By
FINANSYA LAB
|
2026 © All Rights Reserved.


