Version:
1.0
Updated:
28 April 2025
Downloads:
6
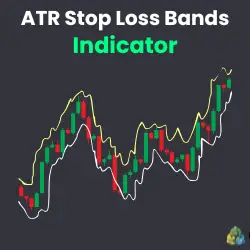
The ATR Stop Loss Bands is a technical analysis indicator for MT4 that displays two dynamic bands above and below the price, based on the Average True Range (ATR) and a Simple Moving Average (SMA). Also available on MetaTrader 5, this indicator helps traders set accurate stop-loss levels by adjusting to market volatility. The upper band suggests where to place stop-losses for short trades, and the lower for long ones.
The ATR Stop Loss Bands is a volatility-based indicator that plots two stop-loss levels around the price candles directly on the MetaTrader charts. It combines a SMA with the ATR to calculate flexible and adaptive bands.
- Upper Band (Yellow Line): Moving Average + ATR × (1 + Factor)
- Lower Band (White Line): Moving Average - ATR × (1 + Factor)
Furthermore, these bands expand and contract depending on market volatility:
- When volatility increases, the bands widen to accommodate larger price swings.
- When volatility decreases, the bands narrow, providing tighter SL levels and reflecting a calmer market environment.
However, traders often use this indicator to set their stop-loss levels based on their trade direction:
* For Long Positions: Set SL just below the lower band.
* For Short Positions: Place SL just above the upper band.
This indicator ensures that stop-losses are neither too tight (risking premature exit) nor too wide (risking excessive losses), cause it adjusts automatically to volatility.
It's important to note that the ATR SL Bands indicator is not designed for identifying trade entries, trend direction, or generating trading signals. Its primary role is to help traders set volatility-adjusted stop-loss levels after they make a trading decision using other technical analysis indicators, such as trend-following and oscillators.
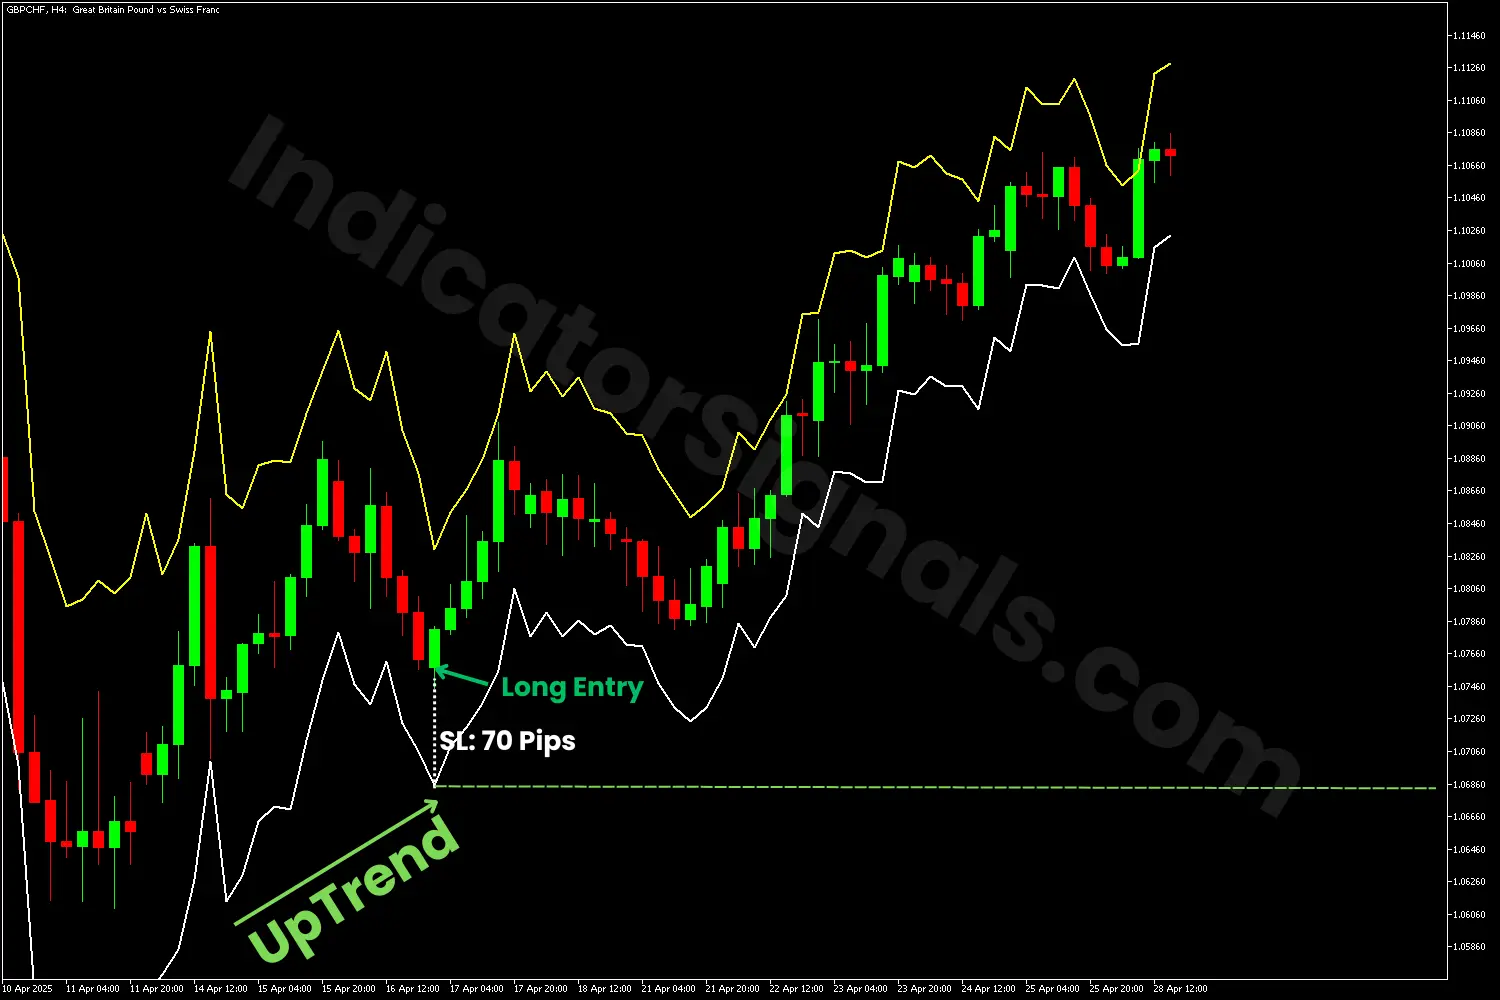
1- In the GBPCHF chart example, using the MT5 version of the ATR Stop Loss Bands indicator, the market was bullish at that moment. After performing my technical analysis, I entered a long position (as shown on the chart). The indicator provided an optimal stop-loss placement just below the lower (white) band, with a risk of 70 pips (H4 Timeframe), and the trader could adjust the risk-to-reward ratio according to his strategy.
Following the entry, the market moved in my favor, continuing its upward momentum even as the price action approached the stop-loss band. As long as the white band remained above my initial stop-loss level, the trade setup remained intact. However, if the bands expand downward and near or breach my stop-loss level, I would consider closing the position to avoid potential losses.
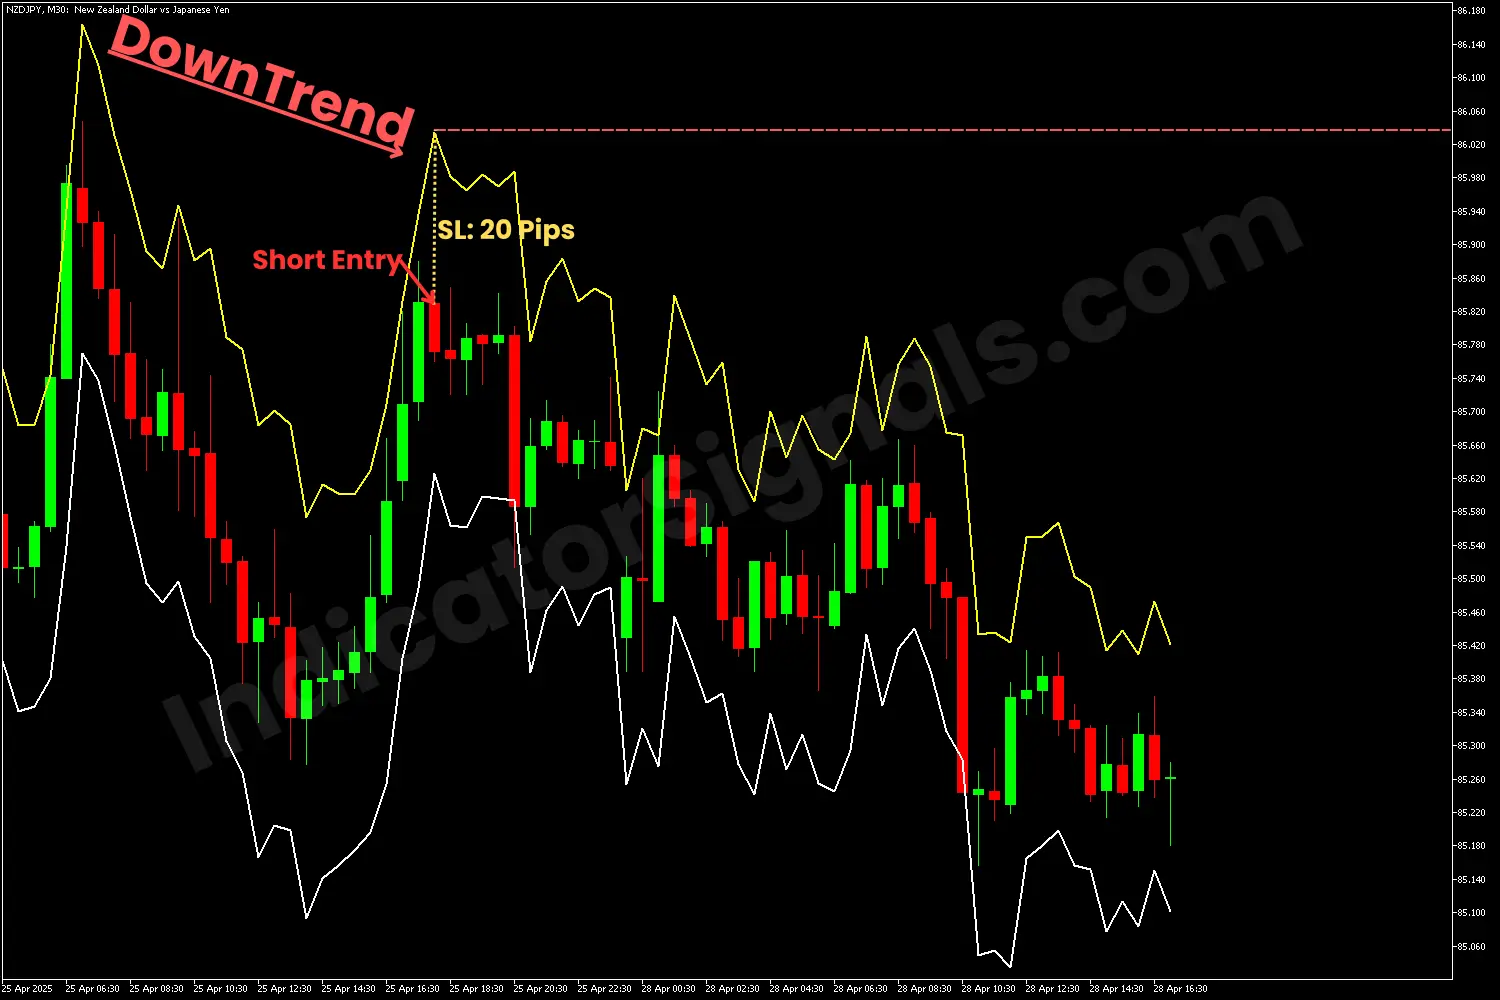
2- In the NZDJPY chart example, using the MT4 version of the ATR Stop Loss Bands indicator, the market was bearish at that moment. After performing my technical analysis, I chose to enter short (as presented on the chart). The indicator provided an optimal stop-loss placement just above the upper (yellow) band, with a risk of 20 pips (M30 Timeframe).
Following the entry, the market moved in my favor, continuing its downward momentum. As long as the yellow band remains below my initial stop-loss level, the trade is going well. However, if the bands expand upward and near or breach my stop-loss level, I would consider closing the position to avoid potential losses.
IndicatorSignals.com - Owned & Operated By
FINANSYA LAB
|
2026 © All Rights Reserved.


