Version:
1.0
Updated:
02 June 2025
Downloads:
0
The Asian Range Highlighter (ARH) is a MetaTrader 5 indicator that visually highlights the highest and lowest prices identified during the Asian session throughout the trading day. Available on the MT4 chart, the ARH helps traders pinpoint dynamic support and resistance levels, giving insight into the market behavior before the European and US sessions begin.
The Asian Range Highlighter is a pattern-based indicator that detects a consistent and recurring price behavior observed during the Asian trading session, typically between 12:00 AM and 8:00 AM GMT. This range, defined by the session’s high and low price levels, is crucial for traders who aim to anticipate market reactions in the more volatile European and US sessions.
Once plotted on the MetaTrader chart, the indicator draws horizontal lines representing session-specific support and resistance levels, allowing traders to plan their trades based on expected price movements. These levels serve as a framework for identifying breakouts or range-bound trading opportunities, commonly used in intraday strategies.
- Breakout Trading Strategy:
- Bullish Breakout: If the price breaks above the Asian session high during the European or US session, it indicates strong bullish momentum, suggesting a potential long entry in anticipation of continued upside movement.
- Bearish Breakout: Conversely, a drop below the Asian session low signals bearish strength and may present a short-selling opportunity, anticipating further downside continuation.
- Range-Bound Strategy:
If the price remains confined within the Asian range, it reflects a low-volatility environment, where traders can apply mean-reversion strategies. In such cases:
- Short positions can be considered when the price rejects the upper boundary (resistance).
- Long positions can be initiated when the price rebounds from the lower boundary (support).
This indicator proves especially useful for day traders and scalpers, offering a structured approach to capturing market moves that often originate from key session transitions. For improved accuracy, it is recommended to combine it with volume analysis, candlestick patterns, or momentum-based indicators.
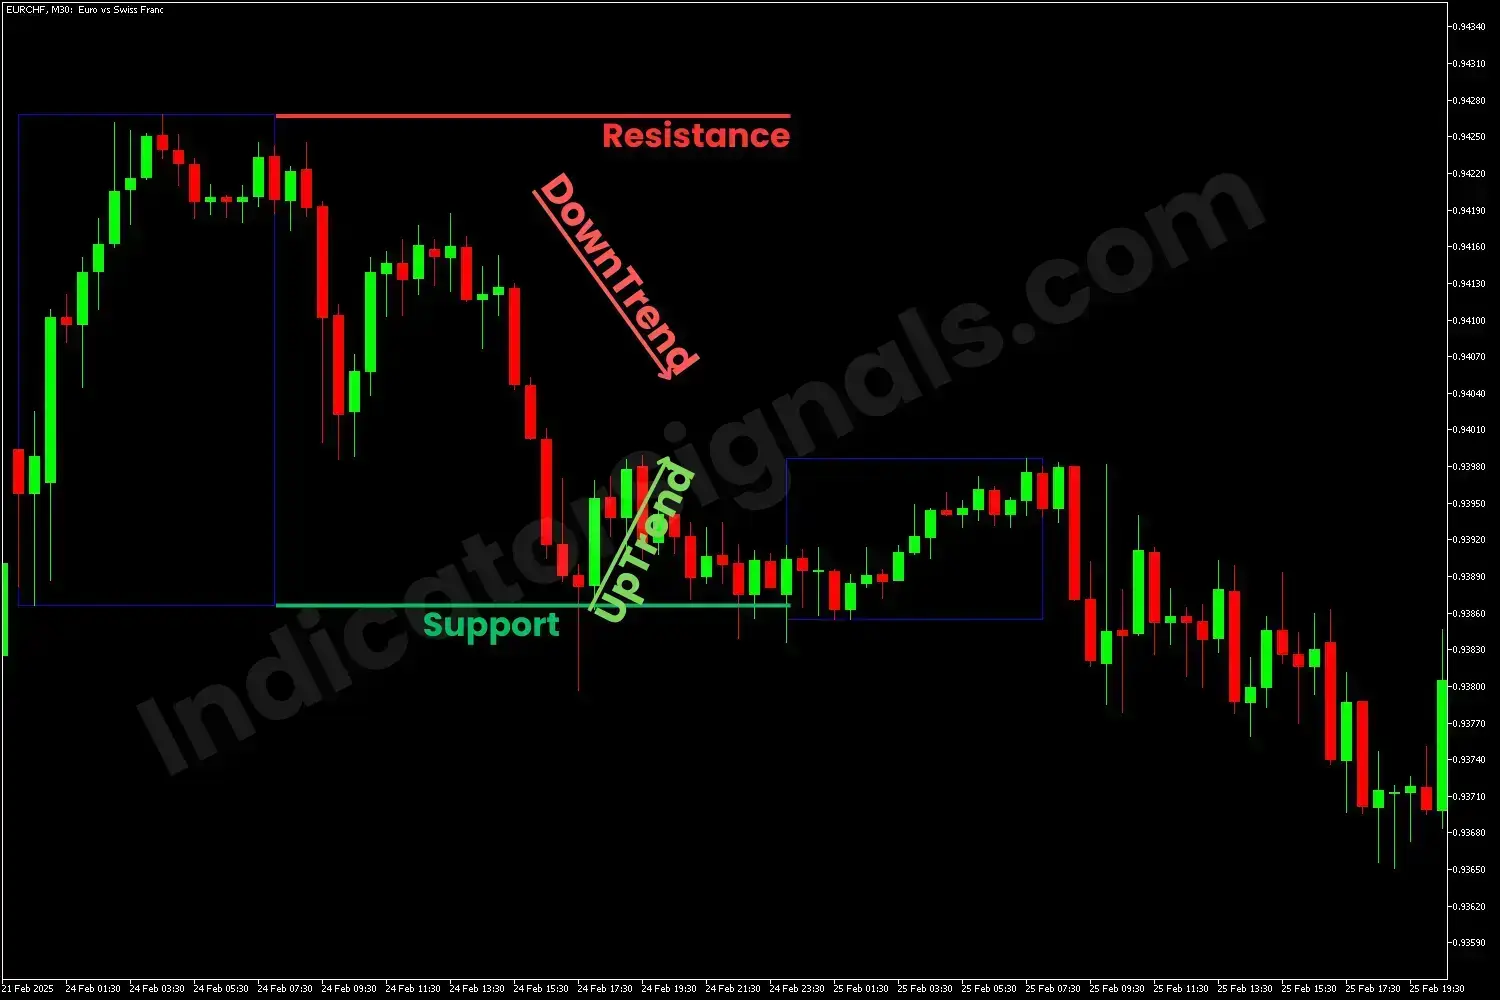
1/ In the EURCHF trading example on MetaTrader 4, the Asian Range Highlighter (ARH) indicator plots a blue range box, visually representing the highest and lowest price levels recorded during the Asian session. This predefined range acts as a crucial reference zone for upcoming trading opportunities. Traders are advised to first draw key support and resistance levels based on the range boundaries and then wait for confirmation signals before entering any trades during the London or New York sessions.
In this scenario, as the price approaches and rejects the resistance level, it signals a potential short opportunity. Conversely, when the price rebounds from the support line, it suggests a buying opportunity. This chart setup serves as a practical illustration of range-bound trading, showing how traders can capitalize on market indecision within defined session ranges.
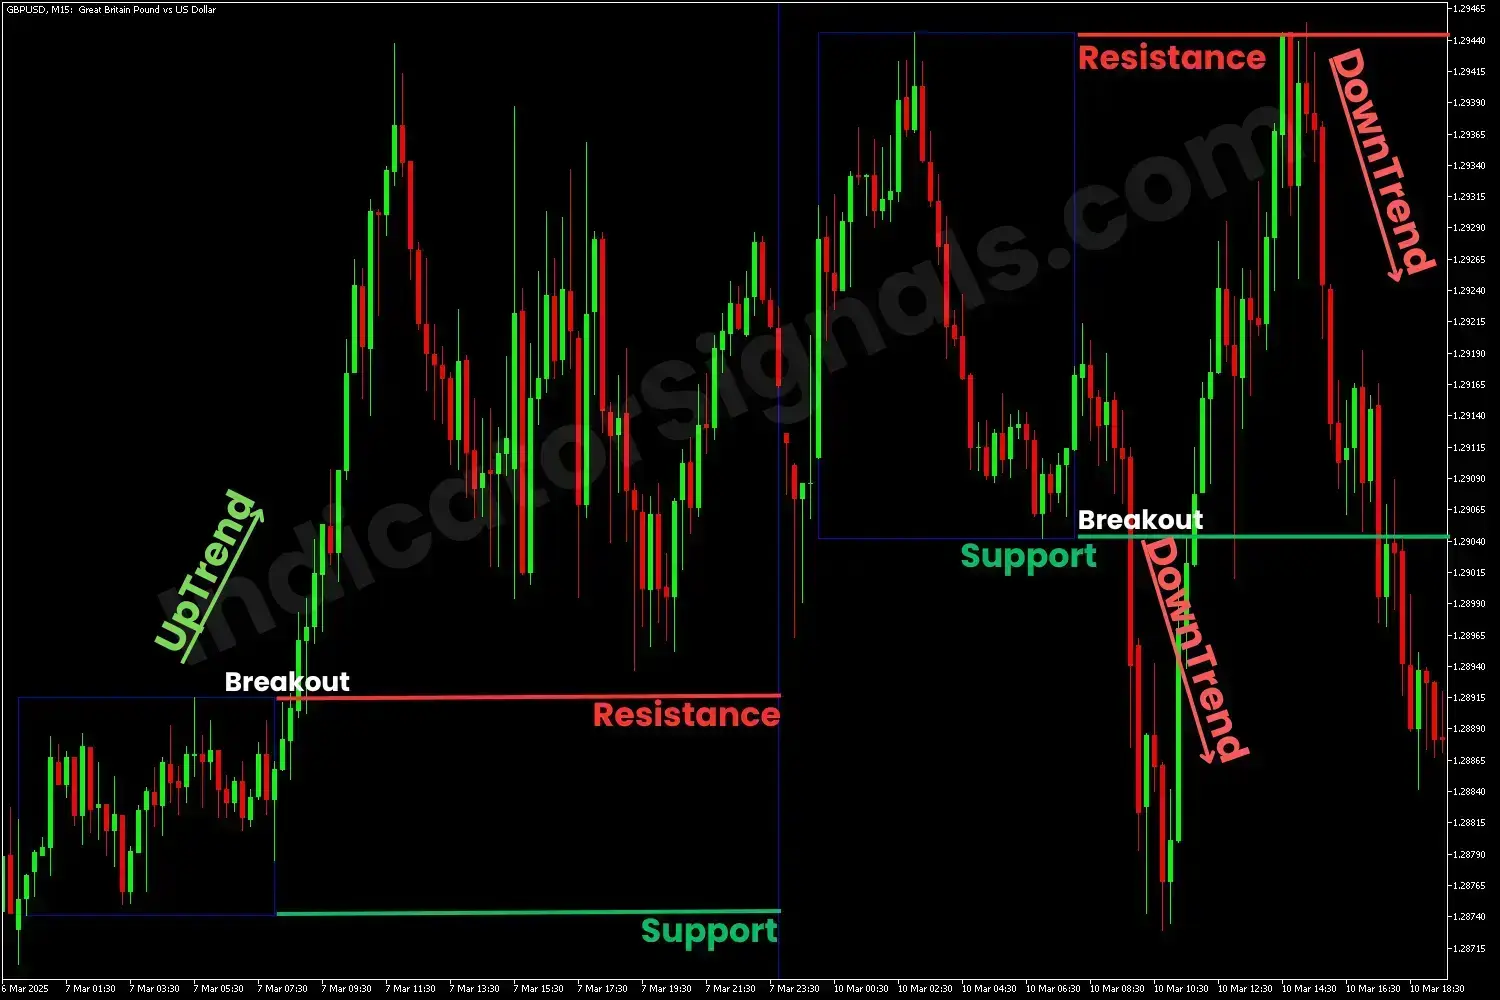
2/ In the GBPUSD trading example on MetaTrader 5, the ARH indicator plots two consecutive blue range boxes, each highlighting the high and low of the Asian session on separate trading days. To make any trade decisions, traders should draw horizontal support and resistance levels derived from these boxes and monitor price behavior around these key zones for confirmation.
In the first range, the break above the resistance level marks a bullish breakout, indicating strong buying momentum and a favorable opportunity to enter a long position.
In the second range, a break below the support level suggests a continuation of the bearish trend, presenting a potential short opportunity. Later, when the price rises above the same support line, it implies a bullish rebound and a chance for a long trade. However, as the price approaches and rejects the resistance line, it indicates a bearish reversal, signaling a possible short entry.
IndicatorSignals.com - Owned & Operated By
FINANSYA LAB
|
2026 © All Rights Reserved.


