Version:
1.0
Updated:
25 February 2025
Downloads:
5
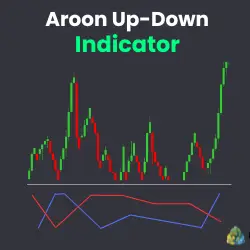
The Aroon Up-Down Indicator on MetaTrader 4 is a technical analysis indicator that identifies the trend's strength and potential changes in structure. It detects the price’s tops and bottoms using, a blue line for Aroon-up and a red line for Aroon-down. Additionally, on MT5, the two lines range between 0 and 100 levels to help traders identify whether the price rises or drops and make an informed trade decision.
The Aroon Up-Down Indicator is classified as a trend-following indicator, developed by Tushar Chande in 1995, designed to identify the trend's strength and direction and spot potential reversals.
As we already know, the price will close regularly, during an uptrend, at new highs, and during a downtrend, at new lows. This is shown through this indicator which consists of two lines in its formula:
- Aroon Up (Blue Line) = [ ( N - Days since Highest high ) / N ] * 100
- Aroon Down (Red Line) = [ ( N - Days since Lowest low ) / N ] * 100
Where;
- N: Lookback Period.
- Days since Highest high: Number of bars since the last highest high within the period N.
- Days since Lowest low: Number of bars since the last lowest low within the period N.
By applying the Aroon Up-Down on MetaTrader 4, traders can analyze its two lines within five levels (0, 30, 50, 70, and 100) to identify optimal entry and exit points, to enhance their trading strategies.
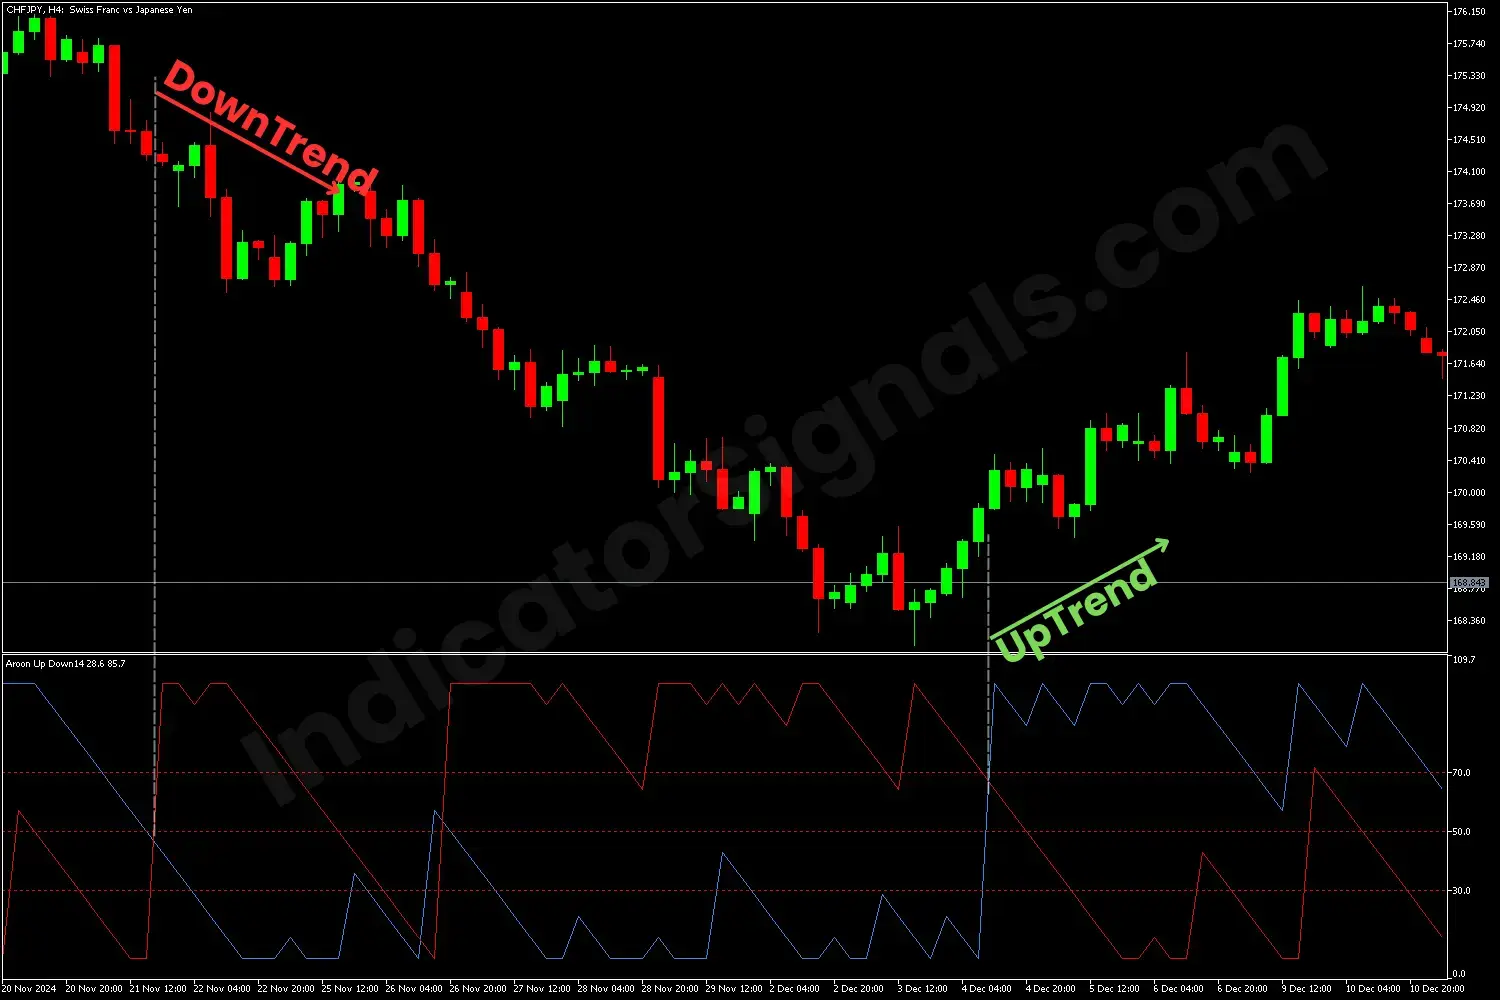
On the CHFJPY example in metatrader 4, during a downtrend, the blue line drops below the 30 level while the Aroon-down line rises, crosses above the up-line, and exceeds the 70 level, confirming a strong bearish trend. During this period, the two lines remain above and below the two levels until they change position and cross each other up-down signaling a potential reversal, indicating the beginning of an uptrend.
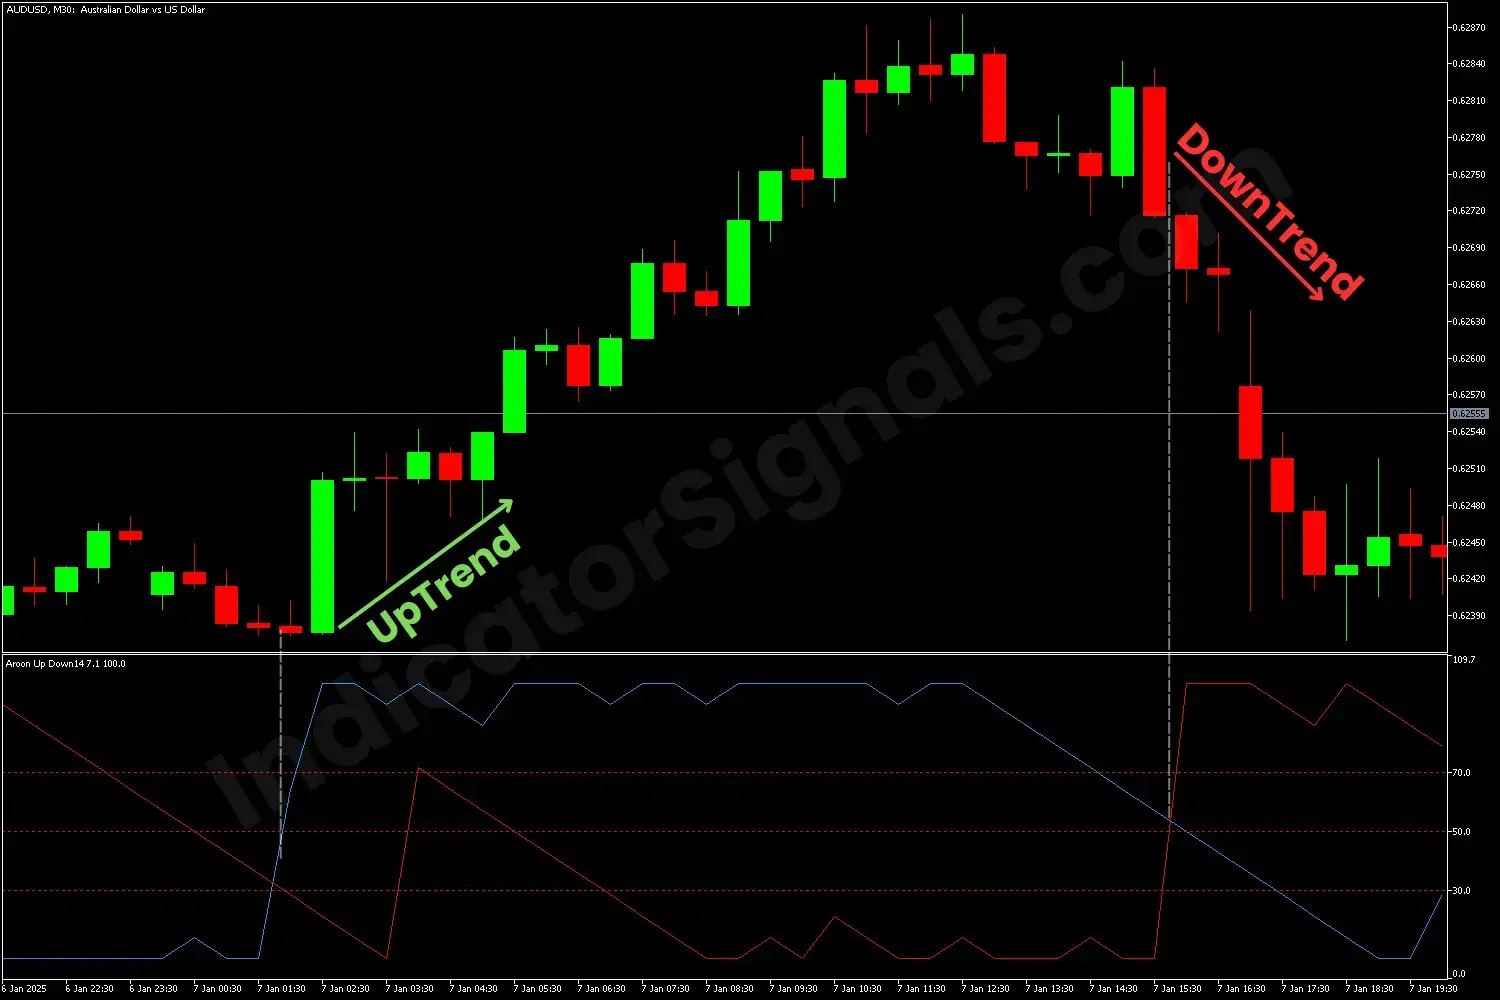
On the AUDUSD chart in metatrader 5, at the start of an uptrend, the Aroon up-line climbs above the 70 level while the red line crosses the other line and falls below the 30 level, signaling a long opportunity for the trader. These positions remain unchanged until the lines cross again, signaling a potential reversal and a selling opportunity.
For optimal results, we highly recommended using the Aroon Up-Down Indicator alongside other technical indicators for improved accuracy and confirmation, such as momentum indicators (MACD 2 lines, RSI) and volume indicators (VWMA).
IndicatorSignals.com - Owned & Operated By
FINANSYA LAB
|
2026 © All Rights Reserved.


