Version:
1.0
Updated:
26 May 2025
Downloads:
0
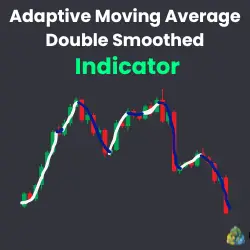
The Adaptive Moving Average Double Smoothed (AMA-DS) is a trend-following indicator on MetaTrader 5 that adapts its smoothing speed based on market volatility. It calculates a double-smoothed moving average to reduce noise while remaining responsive to price changes. The indicator changes color to indicate trend direction: rising (bullish) or falling (bearish), helping traders identify trend direction and pinpoint entry and exit points.
The AMA-DS indicator adjusts its smoothing factor according to price volatility, allowing it to react faster during trending markets and slower during consolidations to filter out noise. Unlike a simple moving average, the AMA uses a volatility measure based on the recent price range to adapt its smoothing constant between a fast and a slow period.
This particular AMA variant applies a double smoothing process:
- First smoothing adjusts the moving average with an adaptive smoothing factor based on the normalized price position within the recent min-max range.
- Second smoothing further smooths this adaptive average to reduce whipsaws and false signals.
Moreover, this indicator outputs a single line on the price chart, colored to show trend direction:
- White line when the AMA is rising (indicating upward momentum).
- Blue line when falling (indicating downward momentum).
However, the AMA-DS includes the following parameters:
* Period: the lookback window for volatility and range measurement (14 by default).
* Fast Period: the fastest smoothing constant (2 by default).
* Slow Period: the slowest smoothing constant (30 by default).
* Applied Price: price type (close, open, high, low, median,...).
Furthermore, traders use this indicator in several trading strategies, such as:
- Trend Identification:
- When the AMA line is rising (colored White), the market is bullish.
- When the AMA line falls (colored Blue), the market is bearish.
- Entry Signals:
- Consider entering a long (buy) position when the AMA changes color from falling to rising.
- Consider entering a short (sell) position when the AMA changes color from rising to falling.
- Exit Signals:
- Exit long trades when the AMA line starts falling.
- Exit short trades when the AMA line starts rising.
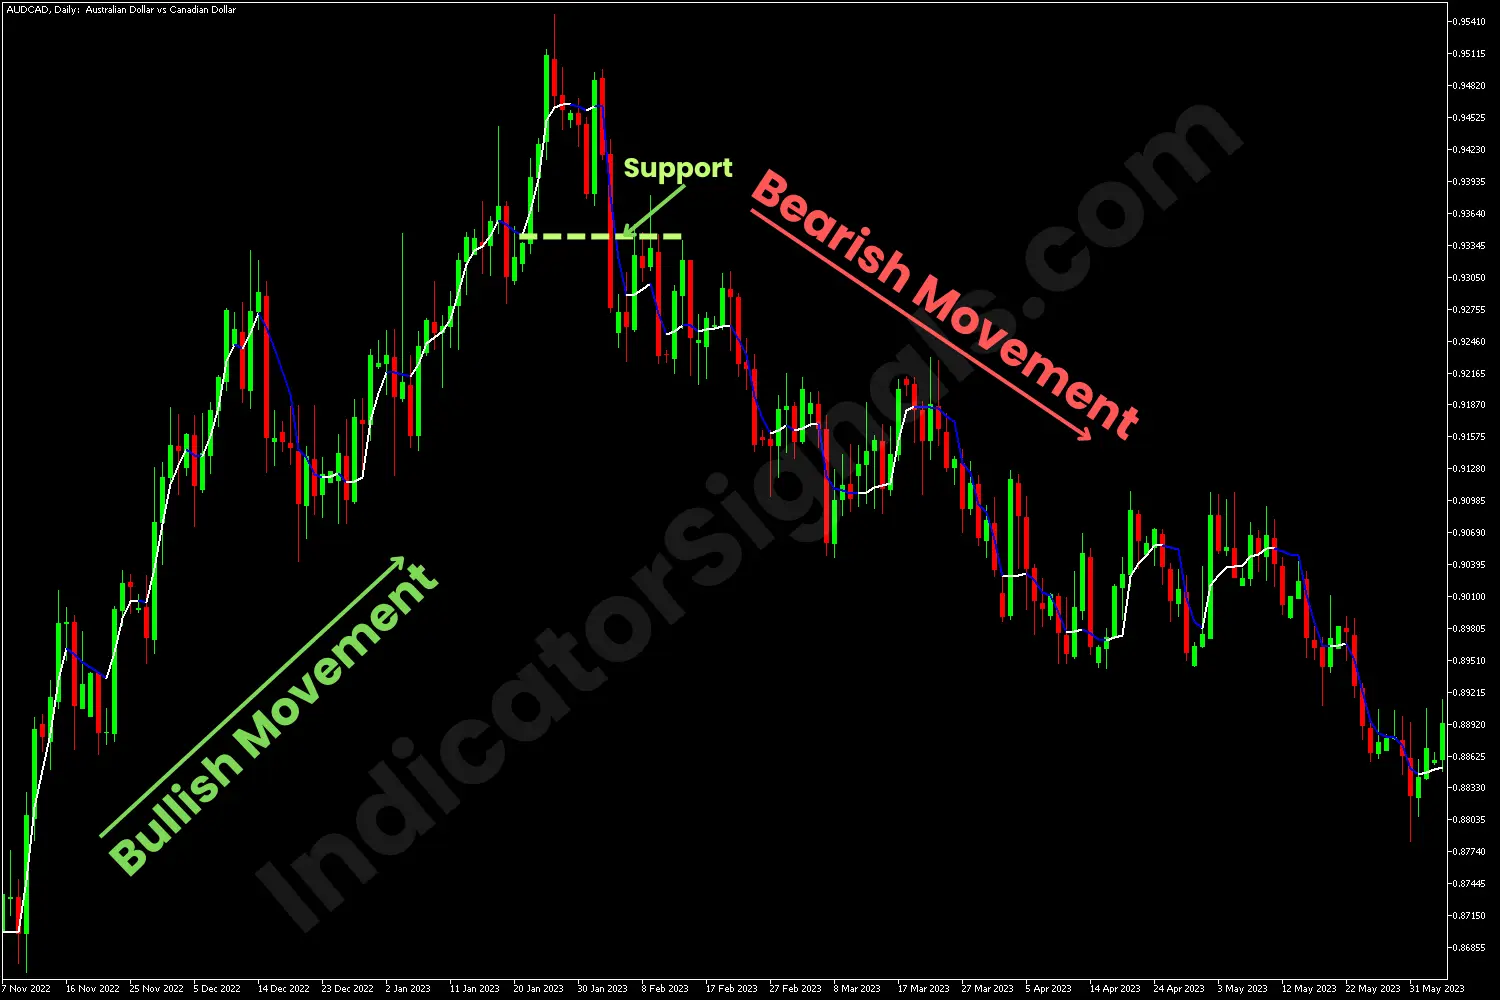
1- In the first trading example using the AMA DS indicator, an upward trend was confirmed as the indicator consistently displayed a white line over an extended period. Traders could consider entering a long position after the first pullback, marked by a brief appearance of a blue line, followed by a return to white, signaling a continuation of the bullish trend. The upward movement persisted, offering a solid profit opportunity.
Toward the trend's end, the emergence of a long blue segment indicated a potential bearish reversal and served as a warning to exit the long trade. Once the blue line broke below the last support level, it confirmed the beginning of a downtrend, signaling a potential short entry on the AUDCAD pair. This early signal allowed traders to capitalize on the subsequent downward movement, as illustrated on the MT5 chart.
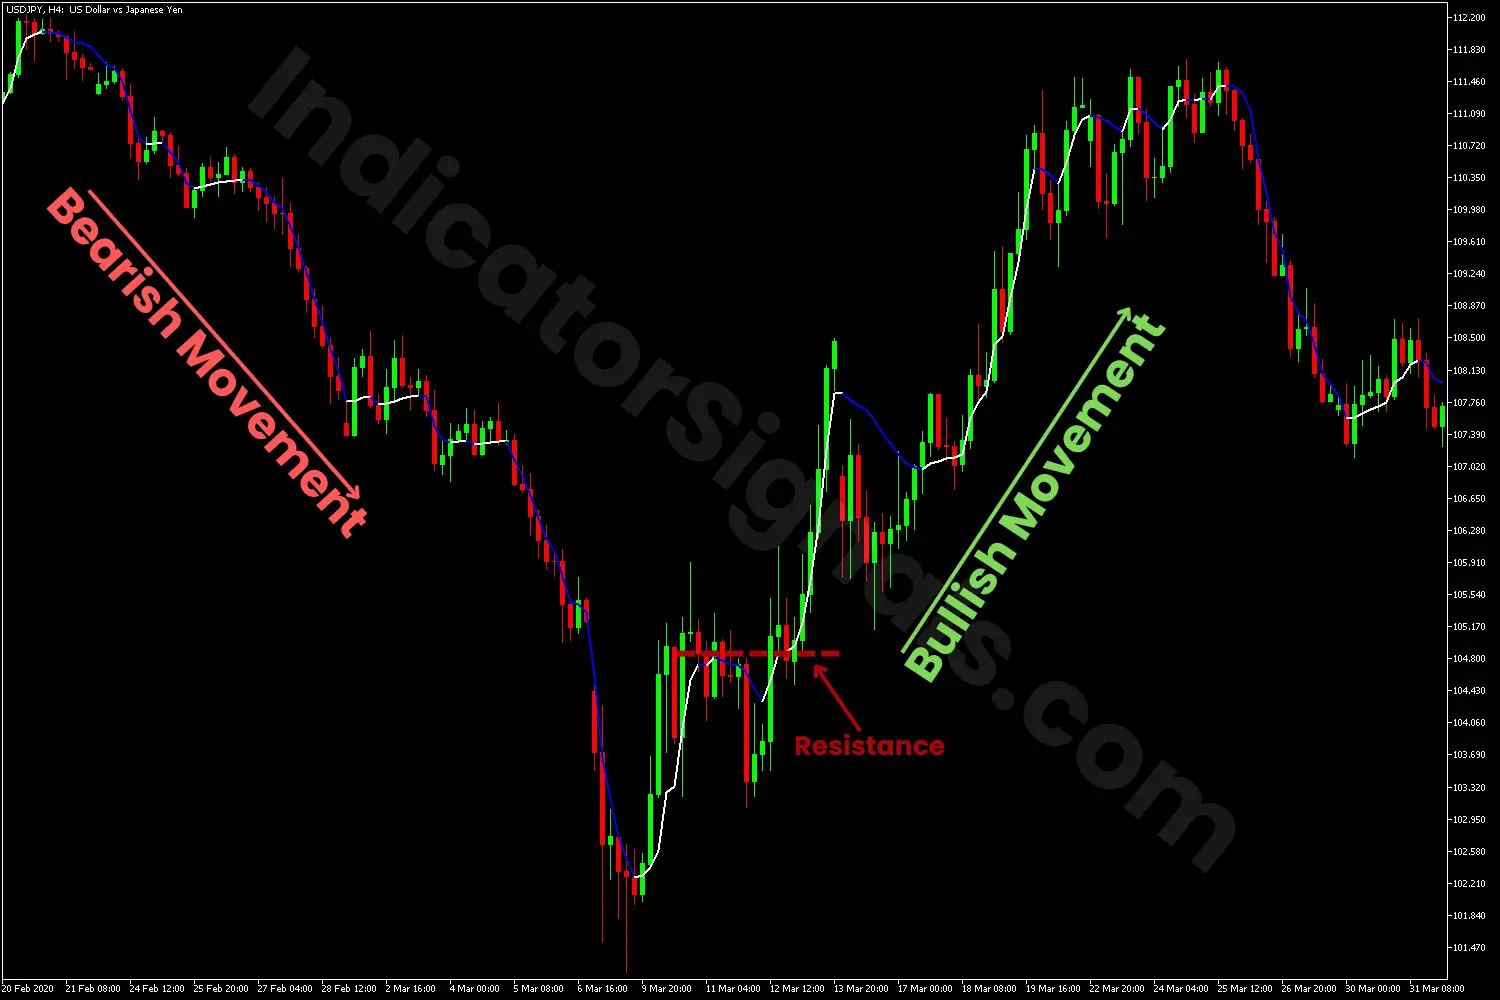
2- In the second trading example using the AMA DS indicator, a downward trend was confirmed as the indicator consistently displayed a bearish line over an extended period. Traders could consider entering a short position after the first pullback, marked by a brief appearance of a white line, followed by a return to blue, signaling a continuation of the bearish trend. The downward movement continued, offering a good profit opportunity.
Toward the trend's end, the reappearance of a long white segment indicated a potential bullish reversal and served as a warning to exit the selling position. Once the bullish line broke above the last resistance level, it confirmed the start of an uptrend, signaling a potential buying entry on the USDJPY pair. This early signal allowed traders to capitalize during the upward movement, as shown on the MT5 chart.
IndicatorSignals.com - Owned & Operated By
FINANSYA LAB
|
2026 © All Rights Reserved.


