Version:
1.0
Updated:
25 February 2025
Downloads:
1
The Accumulation Distribution (A/D) Indicator on MetaTrader 4 is a technical analysis indicator that determines the trend’s strength by measuring the cumulative flow of volume. This indicator, on MT5 also, helps traders confirm the direction of the trend, identify potential reversals, and analyze buying and selling pressure on the market to make the best decision.
The A/D Indicator is classified as a volume-based indicator, developed by Marc Chaikin, that shows whether the market is being accumulated (bought) or distributed (sold) over time by calculating the running total of money flow based on price and volume.
In addition, when the closing price is near the high of the period with strong volume, the indicator will move up signaling accumulation, and conversely, when the price closes near the low, will move down indicating distribution.
Furthermore, the A/D is useful in identifying divergences between price movement and volume flow, which will indicate potential trend reversals.
Here below is how this indicator is calculated over a specific period (i):
- A/D(i) = A/D(i-1) + MoneyFlow(i)
Where;
- MF(i) = CLV(i) x Volume(i)
- CLV(i) = ( Close(i) – Low(i) ) - ( High(i) – Close(i) ) / ( High(i) – Low(i) )
In the following two trading examples on MetaTrader, we will discuss how the trader can use the A/D Indicator in both accumulating or distribution market conditions and also during divergence.
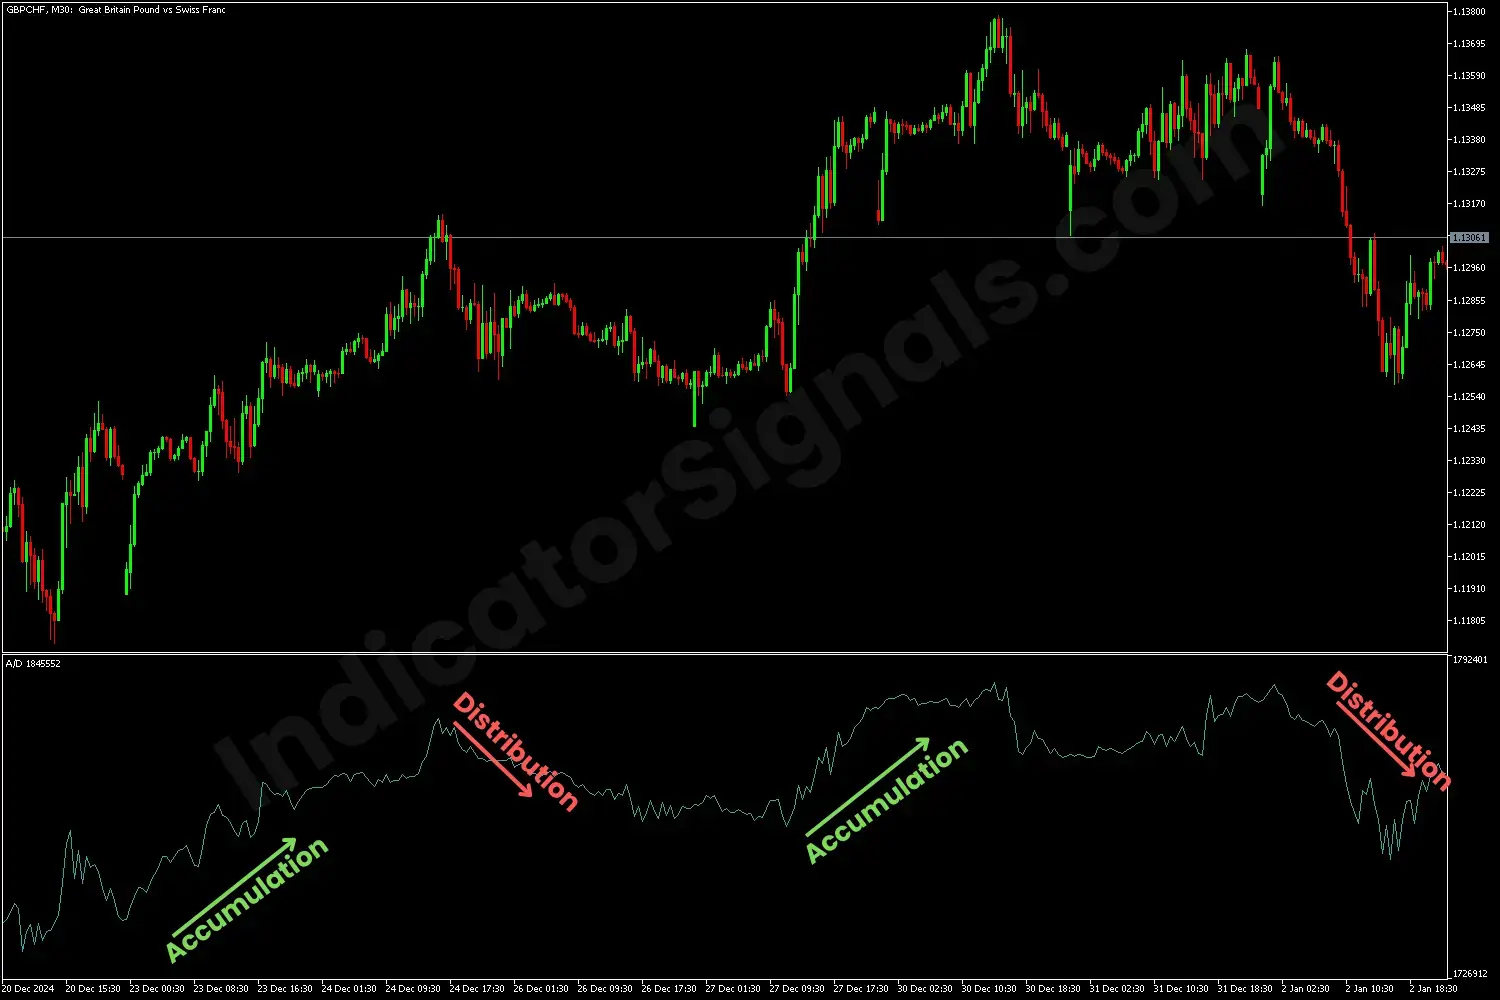
In the first screenshot from MT4, at the start of the trend, the A/D shows accumulation, signaling a long opportunity for the trader. Additionally, when the indicator loses volume and declines, it indicates market distribution, signaling a selling opportunity as the price moves down. Furthermore, whenever the A/D rises, it signals another buying opportunity, and the trader can go short when the volume declines.
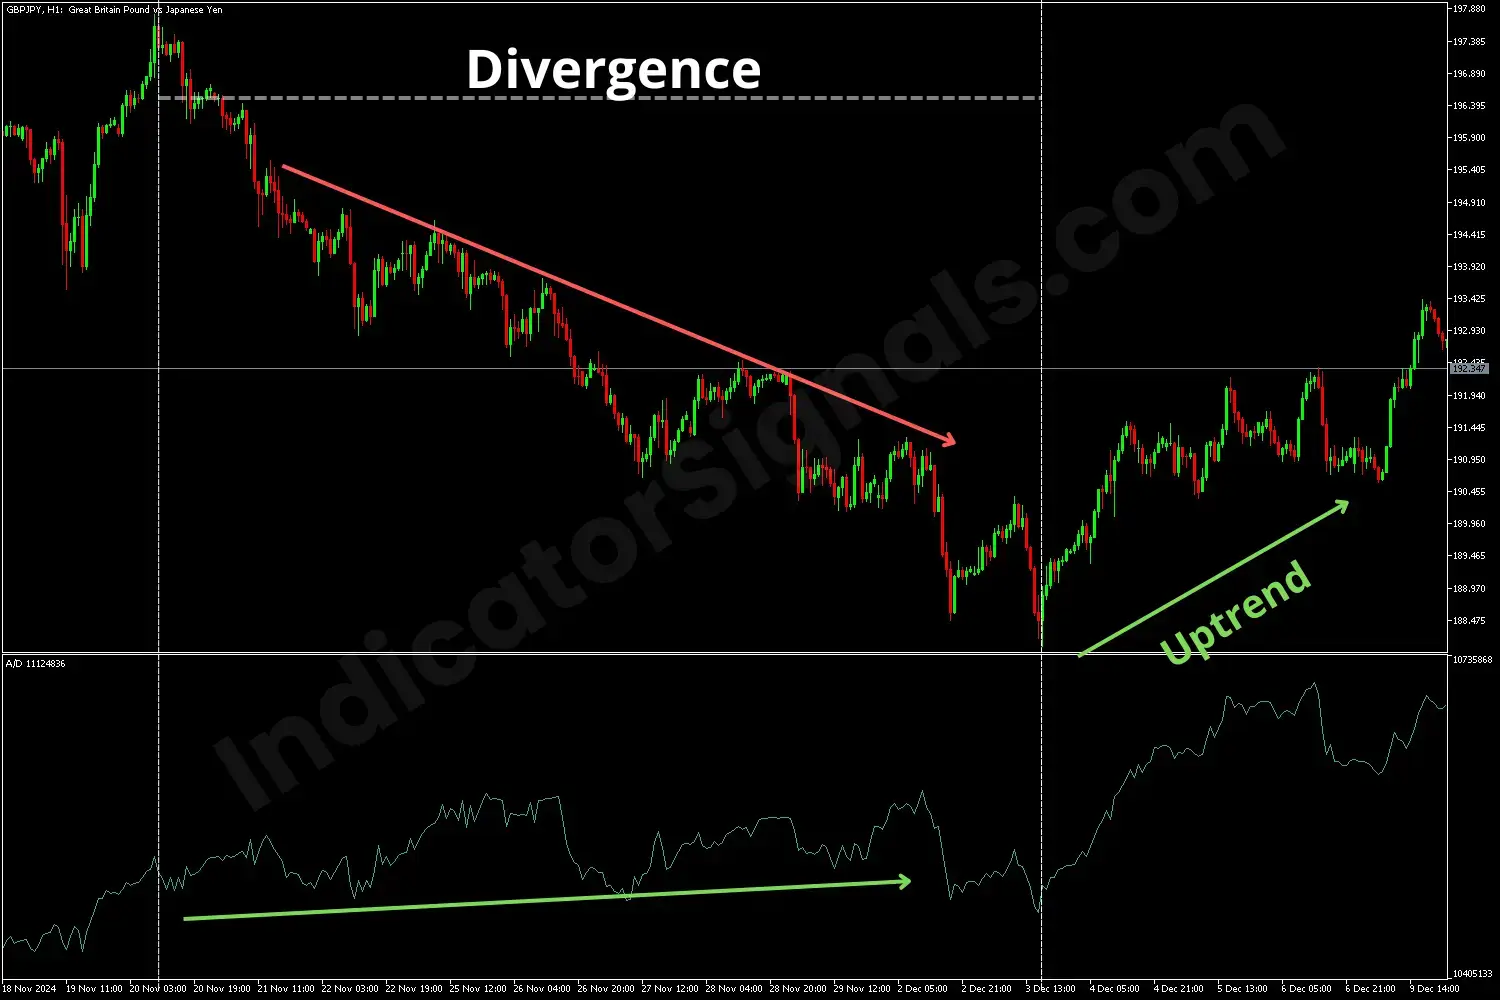
In the second example from MT5, during a downtrend, the price continues to fall, but on the other hand, the A/D rises, indicating a divergence between price movement and volume flow. This divergence signals a potential long opportunity for the trader as the price begins to move up.
To improve their trading decisions, it is recommended that traders use the A/D in conjunction with other indicators like RSI or MACD.
IndicatorSignals.com - Owned & Operated By
FINANSYA LAB
|
2026 © All Rights Reserved.


