Version:
1.0
Updated:
27 March 2025
Downloads:
2
The Accumulated Volume Pressure (AVP) on MetaTrader 5 is a technical analysis indicator that measures buying and selling pressure by analyzing volume trends. Available also on the MT4 platform for FREE, the AVP accumulates volume data to determine whether bulls or bears dominate on the market, helping traders confirm trends' direction and strength and identify potential reversals.
The Accumulated Volume Pressure is a volume-based indicator designed to assess market sentiment by accumulating volume data over time. It displays, on MetaTrader 4 chart, buying (green line) and selling (red line) pressures based on volume changes, helping traders identify whether buyers or sellers dominate.
For a clear visualization on the MT5 chart, the gap between the two lines, in crossover situations, is filled with lime and red colors, visually emphasizing the strength of market sentiment. Green indicates stronger buying pressure, while red represents stronger selling pressure.
Moreover, the AVP indicator is often used in confirming trends' direction and strength, identifying divergences, and spotting crossovers.
- Trend confirmation:
- Bullish Trend: When the green line remains above the bearish line, and the gap is also colored lime, it indicates strong buying pressure, signaling a long entry or to hold existing buy positions.
- Bearish Trend: When the red line remains below the bullish line, and the gap is colored red, it suggests strong selling pressure, signaling a short entry or to hold existing sell positions.
- Divergence trading:
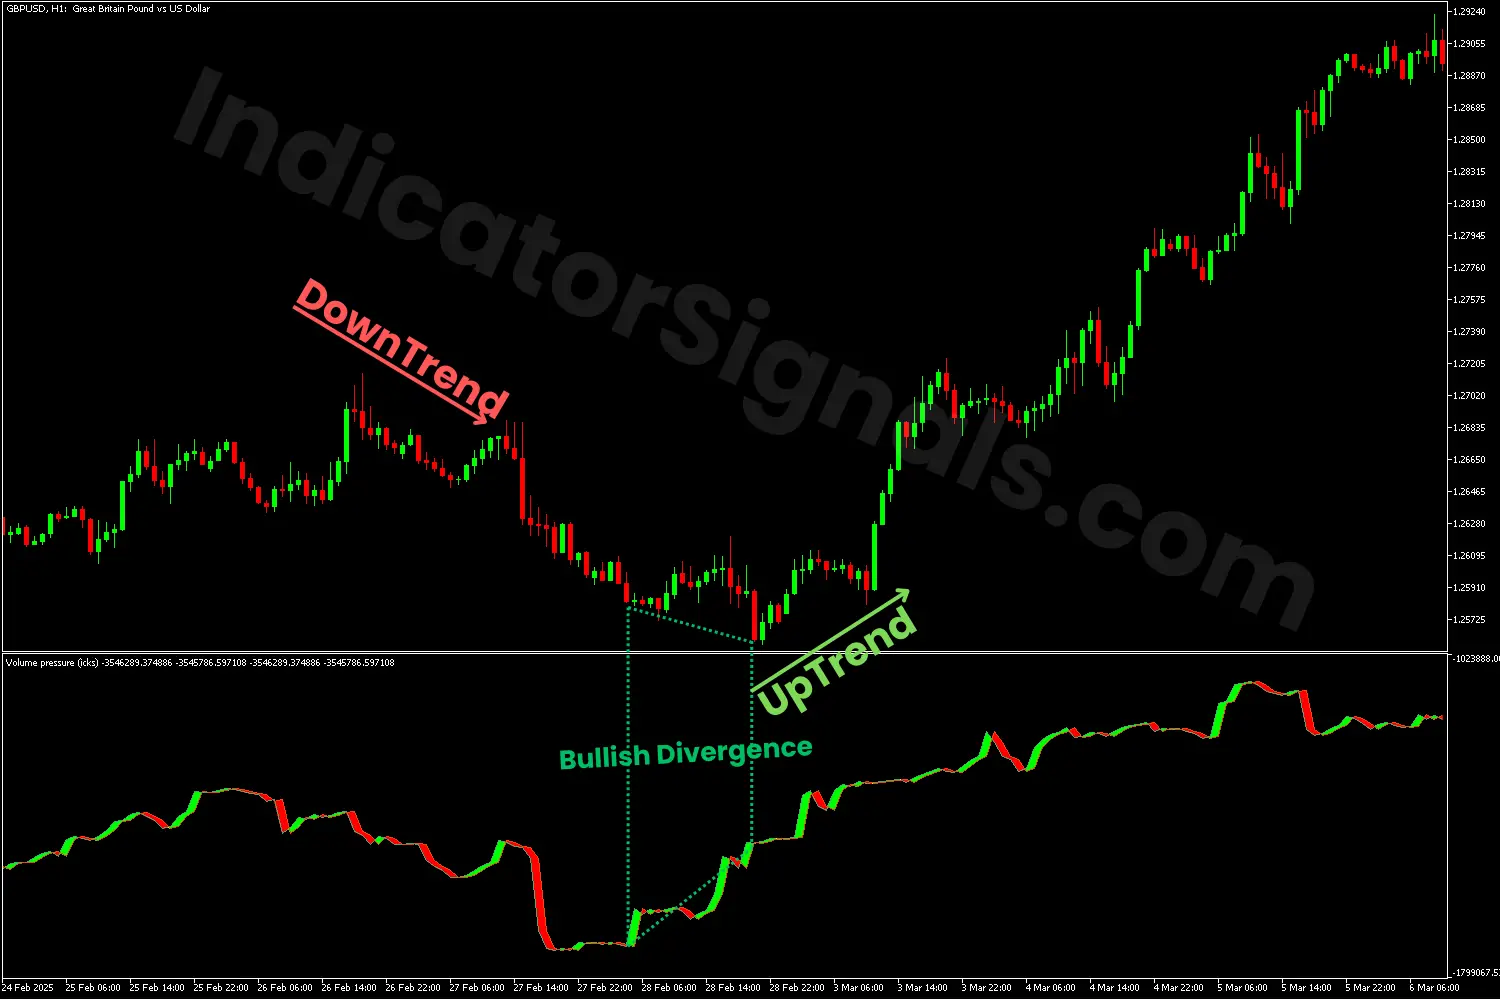
- Bullish divergence: If the price is making lower lows during a downward trend, but the indicator forms higher lows, it signals a potential trend reversal and a long trade opportunity.
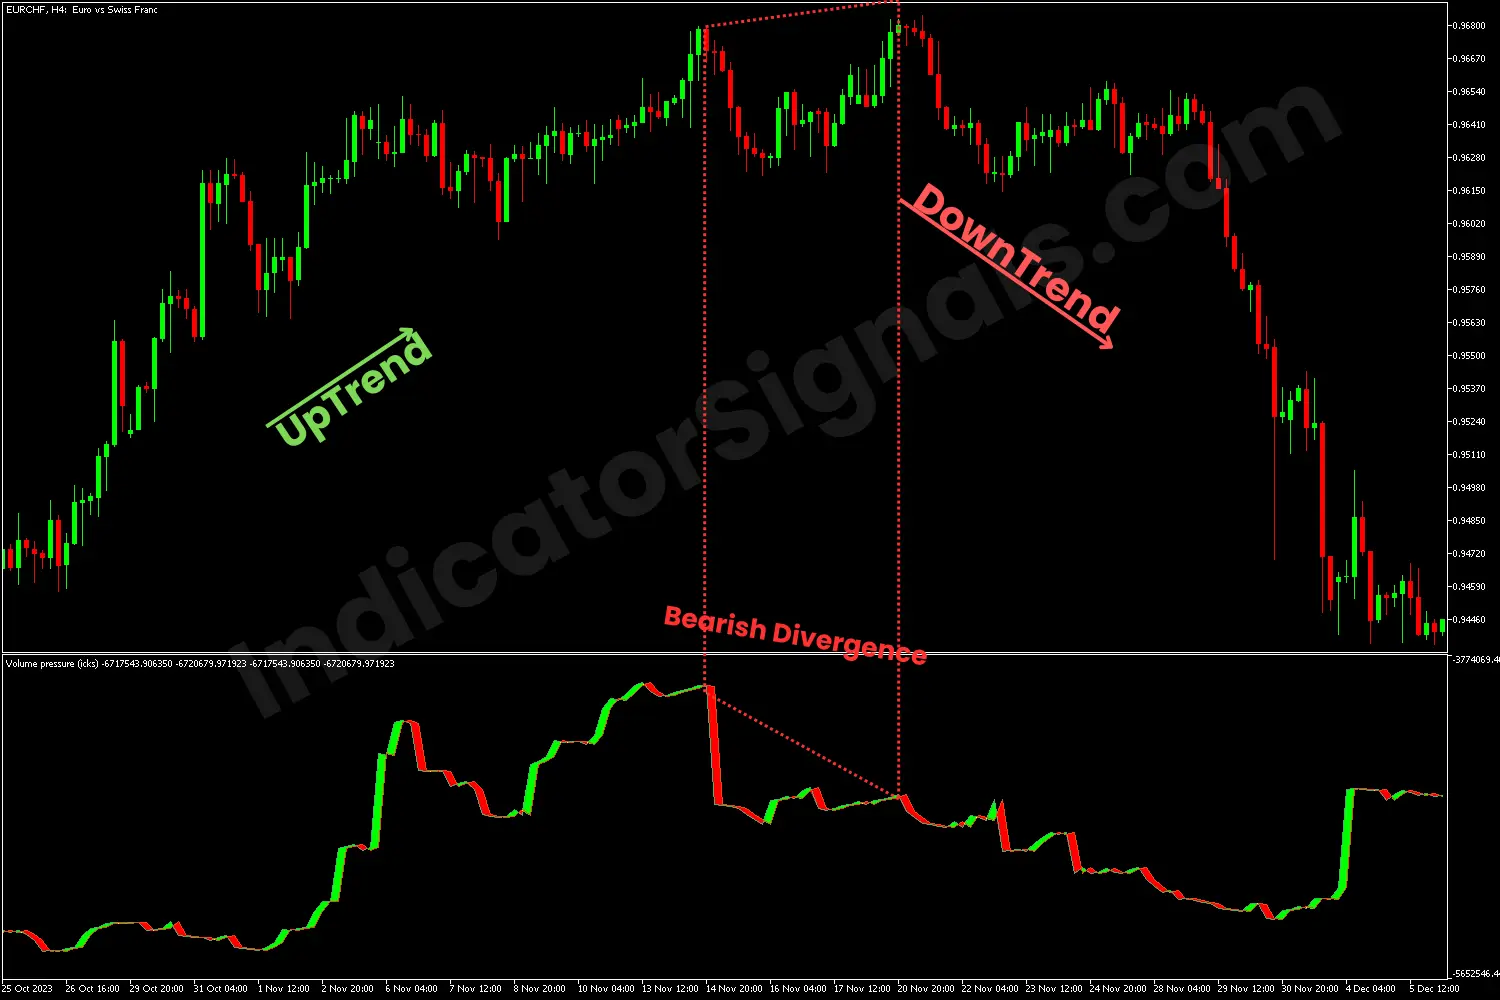
- Bearish divergence: If the price is making higher highs during an upward trend, but the indicator forms lower highs, it indicates a potential trend reversal and a short trade opportunity.
- Crossover signals:
- If the green line crosses above the red one, it signals a buying opportunity, and conversely, a selling opportunity may occur.
To highlight, it is recommended to combine the AVP with other technical analysis indicators for more confirmation to make the best trade decisions.
1/ In the GBPUSD trading example on MetaTrader 5, the AVP indicator's red line remains below the bullish line, with a significant red gap. These conditions confirm the continuation and strength of the downward trend, signaling a strong short opportunity.
Toward the bearish trend's end, the price forms lower lows, but on the other hand, the indicator shows higher lows, which suggests a potential bearish divergence. The bullish volume rising confirms the continuation of the upward trend and signals a strong long opportunity.
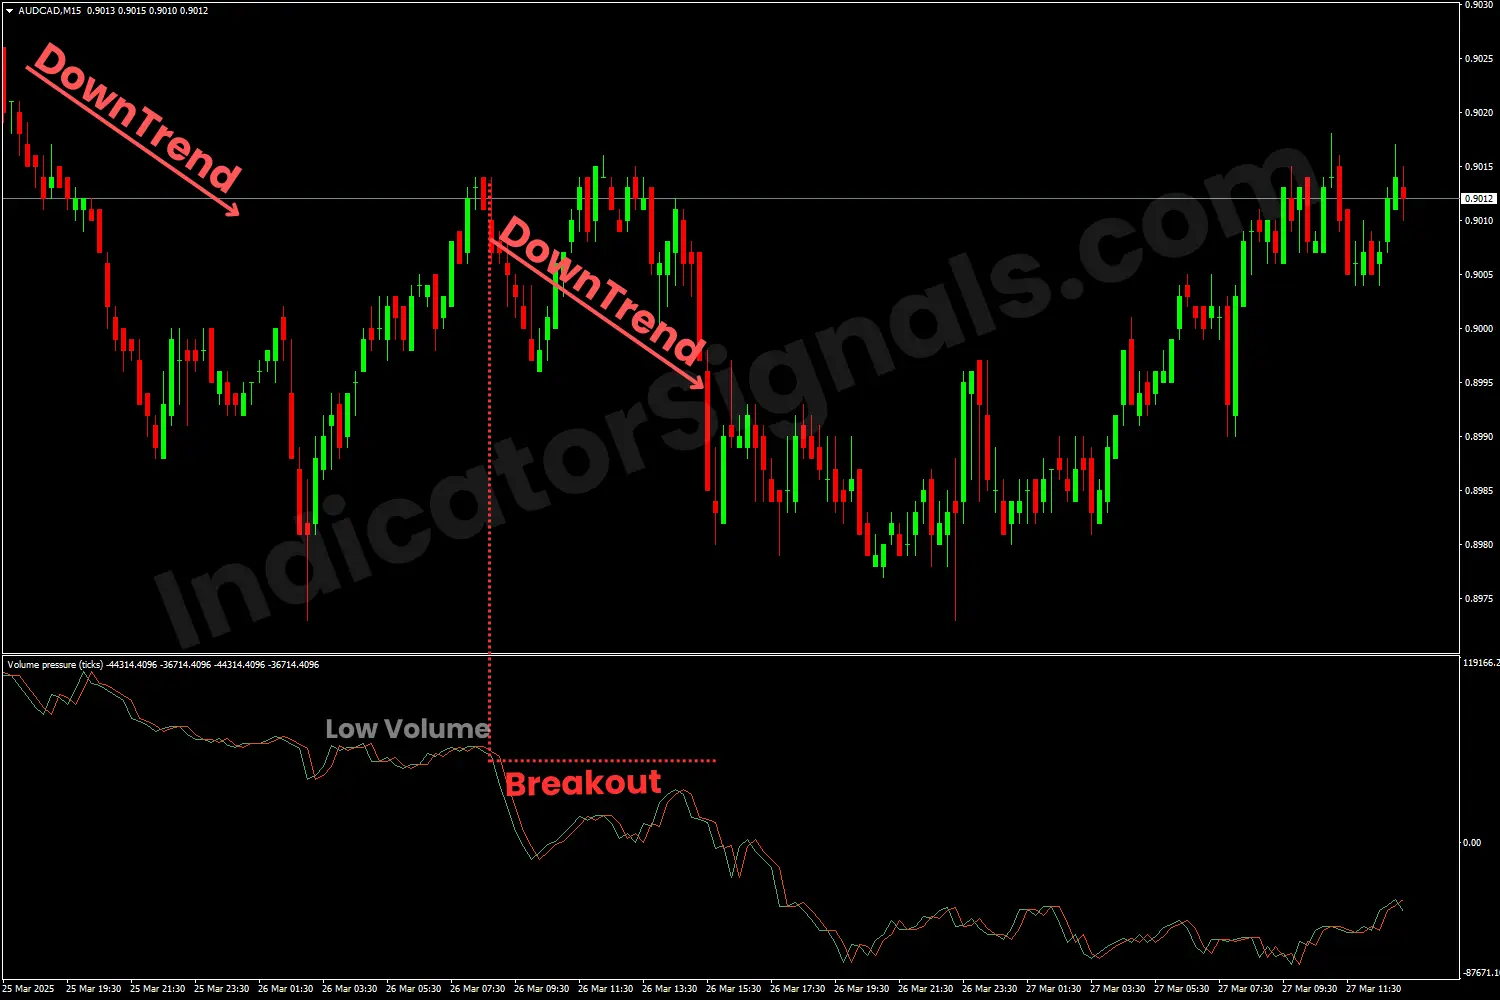
2/ In the AUDCAD trading example on MetaTrader 4, the falling AVP lines confirm a bearish trend. As presented on the screenshot, despite bullish candles suggesting a reversal, low volume and AVP ranging reject it, signaling a correction phase during the downtrend.
As the bearish line breaks below the bullish line, with a high volume, signaling the continuation of the bearish trend and a new selling opportunity appears.
3/ In the EURCHF trading example on MetaTrader 4, the AVP indicator's green line stays above the bearish line, with a noticeable green gap. All of these conditions confirm the strength and continuation of the bullish trend, signaling a strong buying opportunity.
Near the trend's end, the price forms higher highs, but in contrast, the indicator makes lower highs, which anticipates a potential bearish divergence. The bearish volume rising confirms the continuation of the downward trend, signaling a selling opportunity.
IndicatorSignals.com - Owned & Operated By
FINANSYA LAB
|
2026 © All Rights Reserved.


