Version:
1.0
Updated:
13 May 2025
Downloads:
2
The Accelerator Oscillator (AC) for MetaTrader 4 is a momentum indicator that measures the acceleration or deceleration of the current market momentum. Also available on the MT5 platform, this indicator assists traders in identifying trend strength, potential continuations, and early signs of reversals, providing them with more precise entry and exit decisions.
The Accelerator Oscillator (AC) is a technical analysis indicator developed by renowned trader Bill Williams, designed to detect changes in market momentum before the actual price moves. It is based on the Awesome Oscillator (AO) but goes further by calculating the difference between the AO and its 5-period simple moving average (SMA).
On the MetaTrader charts, the AC appears as a histogram with bars above and below the zero line:
- Green bars suggest increasing bullish momentum (acceleration).
- Red bars suggest increasing bearish momentum (deceleration).
- Bars above zero indicate bullish pressure.
- Bars below zero indicate bearish pressure.
Unlike many indicators, the AC is designed to lead the price, helping traders with long and short signals:
1- Buy Signal:
- Two consecutive green bars below the zero line signal bullish movement.
- Enter long when momentum accelerates from below to above zero.
2- Sell Signal:
- Two consecutive red bars below the zero line signal bearish continuation.
- Enter short when momentum decelerates from above to below zero.
However, traders are advised to never trade against the momentum, avoiding buying when AC shows red bars or selling when AC shows green bars. Also, combining it with trend indicators, such as moving averages, Awesome Oscillator, or fractal signals for confirmation.
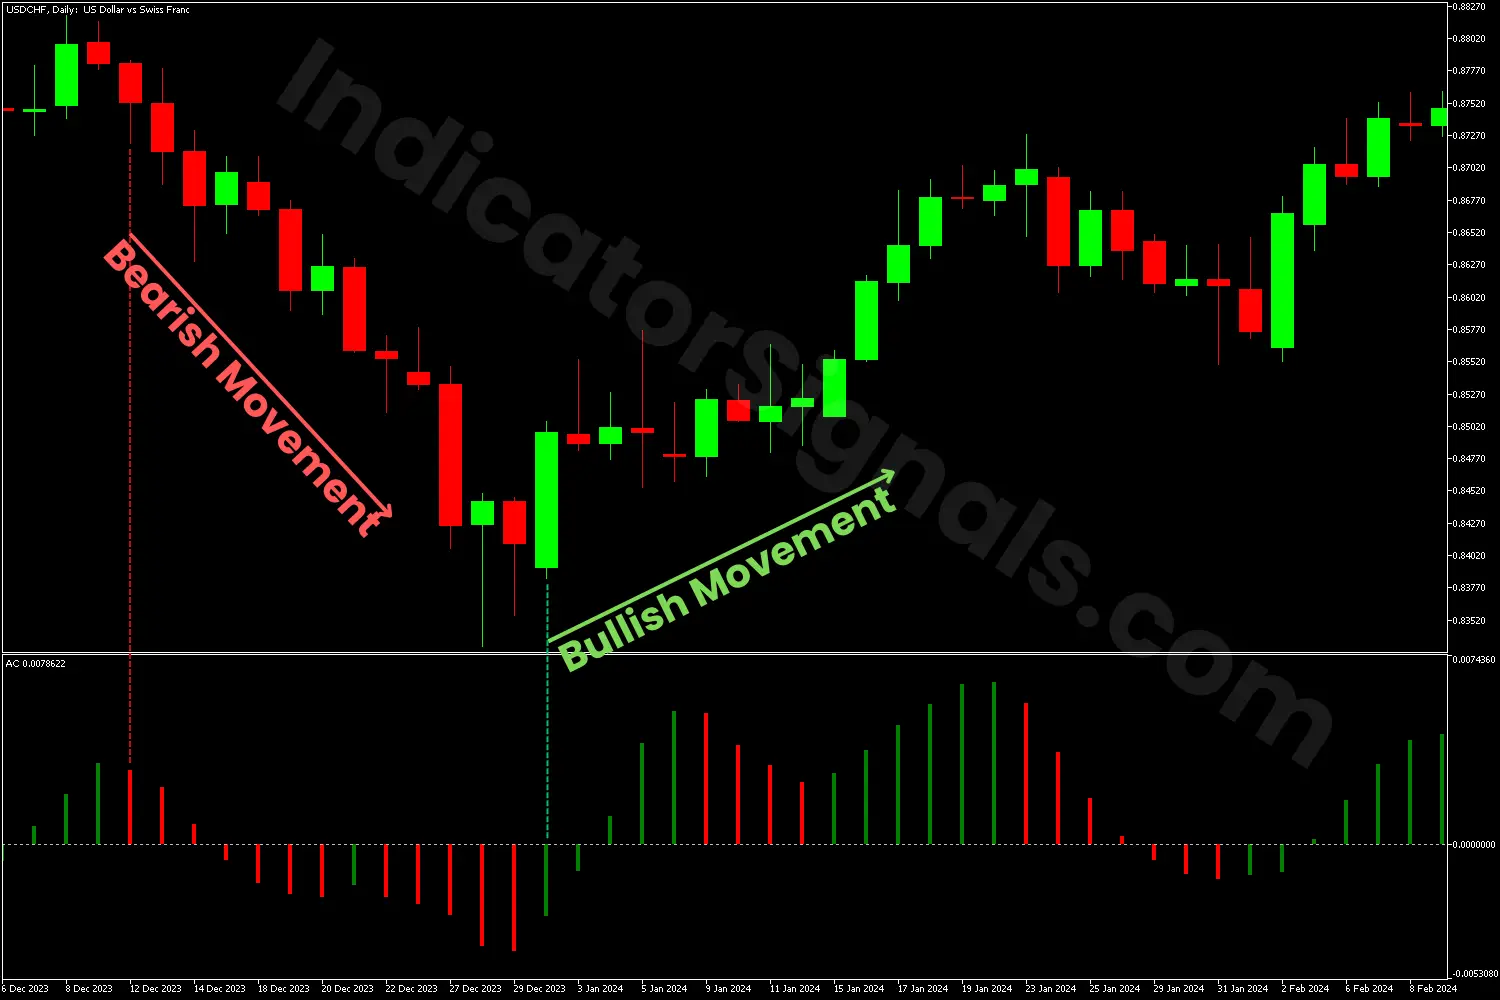
1/ On the USDCHF H4 chart, using the MT4 version of the Accelerator Oscillator, a red bar appeared after a series of green bars above the zero line. This indicated a potential shift in momentum and a potential bearish move, which was confirmed later by a bearish bar breaking below the balance line. Traders could have entered a short position at the first red bar or waited for confirmation when the bars dropped below the zero line.
Toward the end of the downtrend, a green bar appeared alongside a strong bullish candle on the price chart, suggesting a possible bullish reversal. Once the green bars rose above the balance line, it signaled a long entry. This early indication helped traders capture a profitable move using the Accelerator Oscillator.
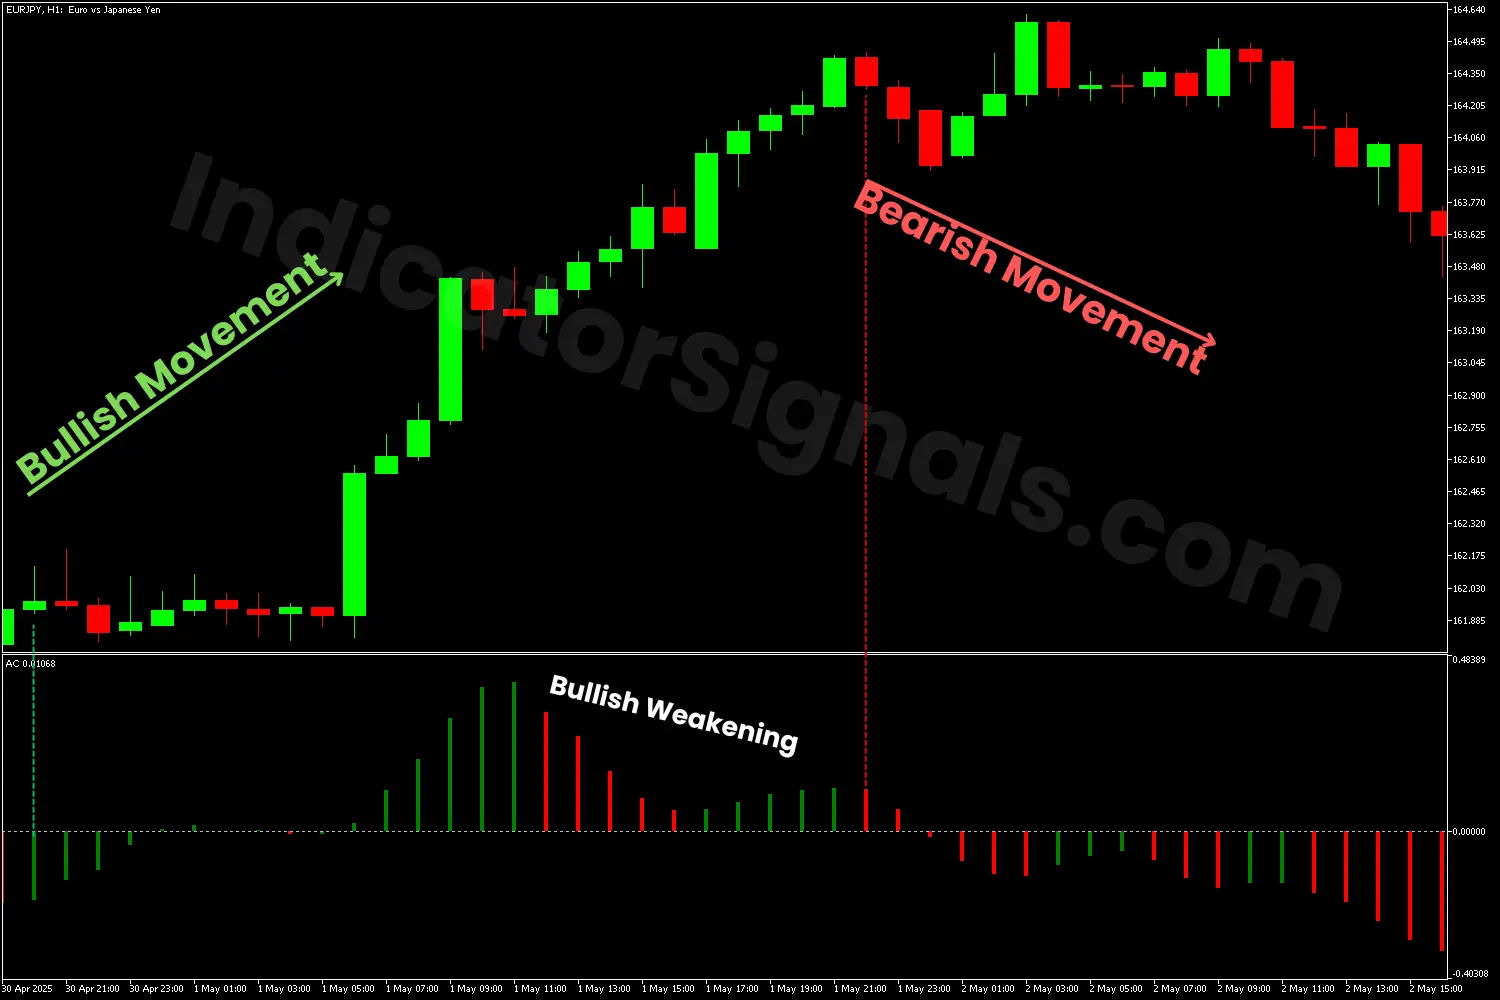
1/ On the EURJPY H1 chart, using the MT5 version of the Accelerator Oscillator, a green bar appeared below the zero line. This indicated a potential shift in momentum and a possible bearish move, which was confirmed later by a bullish bar breaking above the balance line. Traders could have entered long at the first green bar or waited for confirmation when the bars rose above the zero line.
During the upward trend, the indicator showed significant bullish bars, suggesting a bullish weakening. Toward the trend's end, two red bars appeared alongside two bearish candles on the price chart, indicating a potential bearish reversal. Once the bearish bars fell below the balance line, it signaled a short entry for traders, helping them generate profits using the AC indicator.
IndicatorSignals.com - Owned & Operated By
FINANSYA LAB
|
2026 © All Rights Reserved.


